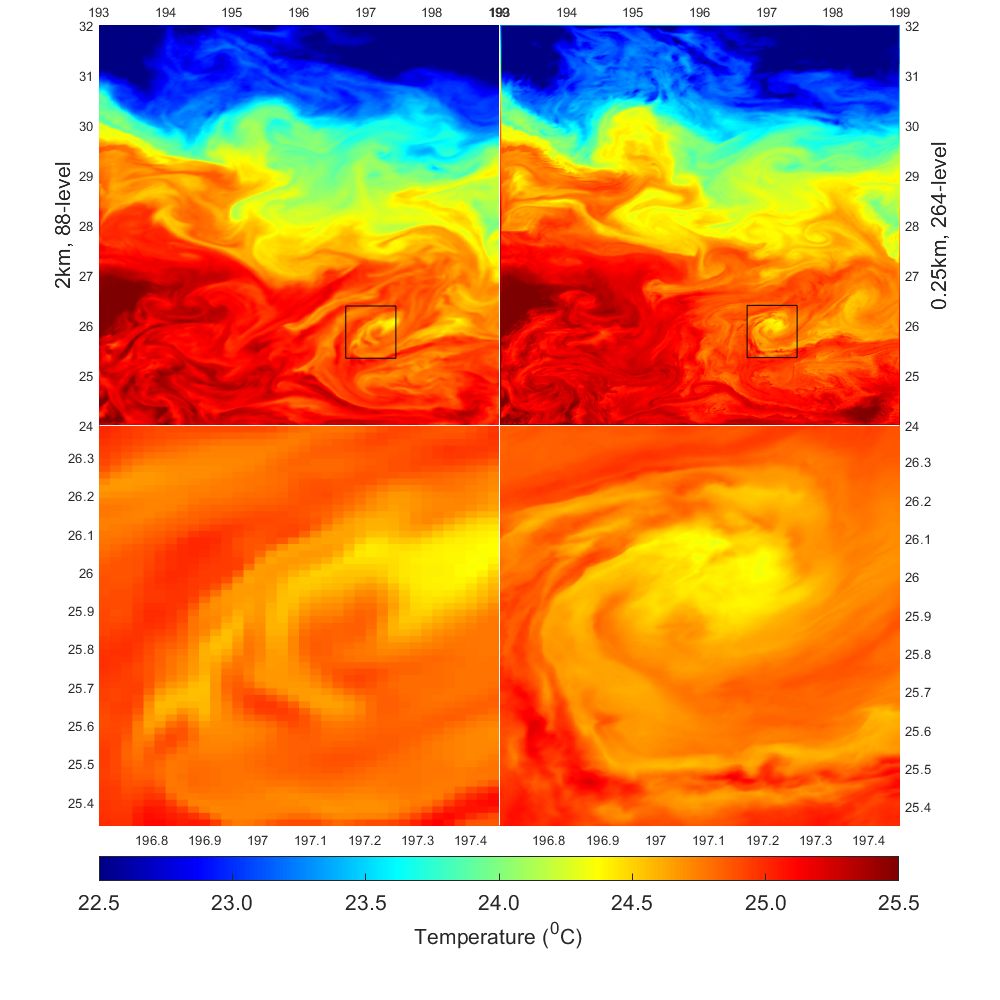
Surface temperature maps and vertical boundaries at the end of the MITgcm 100-day simulation of the ocean within the domain of 24N-32N, 193E-199E just north of Hawaii. On the left is the original simulation run at 2km horizontal resolution and with 88 vertical levels. On the right is the new, higher resolution simulation run at 250m horizontal resolution and with 264 vertical levels made possible thanks to the Niagara supercomputer.
In so many systems—physical, chemical, social—big and important changes start at small scales. Recent research is revealing the extent of this within our oceans, allowing scientists to gain better insight of small-scale effects on key planetary systems and helping them plan new satellite missions.
Teams led by Professor Brian Arbic of the University of Michigan and Dr. Dimitris Menemenlis, a satellite oceanographer at the NASA Jet Propulsion Laboratory (JPL), are collaborating with Professor Dick Peltier of the University of Toronto, and using SciNet’s Niagara—Canada’s most powerful research supercomputer—at the University of Toronto to link how small-scale processes affect the global circulation of our oceans. This circulation in turn impacts global temperatures and weather, and the oceanic health and biology that billions of people around the planet depend on for food.
“In a general sense, the oceans are the flywheel of climate on our planet,” said Dr. Menemenlis. “If we didn’t have oceans, we would have extreme temperatures just between night and day, let alone between seasons. Any subtle changes in the climate, such as when we perturb the concentration of carbon dioxide in the atmosphere, are mediated through exchanges of heat, freshwater, and chemical tracers with the ocean.”
And then, there are the tides. While we generally levels. On the right is the new, higher resolution simulation run at 250m horizontal resolution and with 264 vertical levels made possible thanks to the Niagara supercomputer.
Think of tides as the rise and fall of sea level at the shores, there’s a global impact on the greater ocean that we don’t see.

Beyond the Tides
“Ocean tides are very important for mixing,” stated Professor Arbic. “You can think of the ocean as having stratified layers of different densities, with colder, denser water near the bottom and warmer, less dense water near the top. And layers have interfaces between them. Internal gravity waves are waves lying on these interfaces, for which the force pulling them up and down is gravity. In an internal wave, those interfaces move up and down just like waves at the surface of the ocean, and they can turn over and break just as surface waves do. When internal waves break, they mix. Internal tides—internal gravity waves of tidal frequency—are a special class of internal gravity waves.”
Mixing can change temperatures, bring nutrients up from lower levels, and bring carbon in from the atmosphere, plunging it into the deeper ocean. Carbon and nutrients are important for marine biology; temperature is important for climate. So, these internal gravity waves have an impact on the greater ocean, which impacts life on the planet.
“When we began doing global tidal models some years ago,” commented Professor Arbic, “inserting the astronomical tidal forces from the sun and moon into a simplified model of the stratified ocean, it became apparent that we needed to include the effects of the atmosphere on the ocean. The atmosphere is very different in the tropics compared to the poles, and the ocean responds to that with different stratifications. You can’t get those effects in a model that has only tidal forces. So, we realized that we had to put tides in a model that was also forced by the atmosphere. We first put tides into global circulation models run by the U.S. Navy. That in turn inspired Dimitris to run an even bigger global circulation model with both atmospheric and tidal forcing.”
“At JPL, we use satellite observations to look at the ocean,” added Dr. Menemenlis. “I combine satellite observations with numerical models in order to get estimates of the large-scale ocean circulation. We basically solve large non-linear least squares problems, where the satellite and in-situ ocean observations that we can get hold of are the data constraints. The model that we use is called the Massachusetts Institute of Technology general circulation model (MITgcm), producing realistic numerical simulations of ocean circulation.”
Dr. Menemenlis and his team run these simulations on large supercomputers, like Pleiades and Electra at NASA Ames in California. When he applied tidal forcing to his global model, they discovered that the solutions were very rich. “It’s very interesting and very beautiful what happens to circulation once you start adding tides,” commented Dr. Menemenlis. And, it’s something that they will be able to see with satellites.
NASA has been flying satellites that look at the oceans for many decades. The satellites have sensitive altimeters that look straight down on the ocean surface and record the changes in surface elevation. In a couple of years, a new satellite mission will launch called Surface Water and Ocean Topography (SWOT). This satellite will include a very sensitive swath altimeter that not only looks straight down at the ocean, but also to the side. It will gather data across a swath of about 60 to 80 km on either side of nadir, obtaining a high-resolution, two-dimensional description of the sea surface. In addition to balanced motions (spinning eddies, the oceanic equivalent of atmospheric weather systems), the SWOT data will also contain information about internal tides and other internal waves. To interpret this data, scientists need to be able to discriminate between balanced motions and internal waves.
A Spectrum of Ocean Wave Energy
Earlier research by the two scientists showed how their global models are starting to reveal a spectrum of internal wave energies, not just internal tides. Internal gravity waves, and the breaking waves and mixing across layers that result from them, are due to a number of forces that create waves at varying frequencies. In addition to internal tides, another major source of energy for the internal gravity wave field is atmospheric winds, which create what are called near-inertial waves. Near-inertial waves have a frequency that depends on the rotation of the earth and latitude. Fluid dynamical studies indicate that the interactions of waves forced by tides and winds can create other waves at higher frequencies and smaller length scales. Eventually, when the length scales in the vertical direction become small enough, waves break. Essentially, there is a continuum of wave energies from the depths to the surface of the ocean—from lower tidal frequencies to higher frequencies, and from larger horizontal and vertical length scales to smaller horizontal and vertical length scales.
“The oceans have motions at planetary scales,” explained Professor Arbic. “The big currents transport heat and carbon, but the breaking of internal waves occurs at 10-meter scales, and it eventually cascades energy down to 1-mm scales. There’s just pretty much every frequency (and length scale) beyond a certain limit lighting up with energy. So, you have this very dense array of frequencies (and length scales) in the real ocean that are all highly energetic. And, if you have a coarse resolution model, you just can’t resolve all these different frequencies in calculation. You can’t resolve the difference between one little frequency and another very close to it. Which means we can’t see the smallest waves break in our models. We need to have a model with as high a resolution as possible to get this whole spectrum.”
“For this new very sensitive SWOT altimeter,” commented Dr. Menemenlis, “other internal waves that are excited by internal tides and by the wind will actually cause a lot of noise at a much smaller scale. Therefore, really describing and understanding the impact of these internal tides and internal waves on the sea surface height is critical to being able to understand the signal we will get back from the SWOT satellite.”
That means they need to simulate the global ocean in much, much finer detail.
“But, it’s totally impossible to run a computer model from planetary to 10-meter or to mm scales with the supercomputers we have today. Any simulation you do will miss some of the fine details. So, we’re studying a smaller patch of ocean in finer detail to achieve a better understanding of these small-scale processes.”
Using Niagara to Simulate Internal Waves
Dr. Menemenlis’ numerical global circulation models covered the ocean in grids from 750 meters to 2.3 km horizontally (less at the poles and greater at the equator) and 90 vertical levels that vary in height, from narrower near the surface to wider at greater depths. Since the atmosphere (sun, rain, and carbon) affects the levels closer to the surface, the spacing of vertical levels is finer near the surface. But, to understand the effects of various waves across a continuous spectrum, they are running finer-resolution simulations on a small region of the ocean with horizontal grids that are eight times finer, and 270 vertical levels (instead of 90), with integration time steps of 8 seconds (instead of 25 s).
Previous global models at lower resolution were run on Pleiades and Electra 1 at NASA Ames and on the U.S. Navy’s computers for the hycom.org consortium. Then, Professor Arbic talked with Professor Richard Peltier, Scientific Director of SciNet.
“Dick Peltier came up to me” said Professor Arbic, “after a seminar in which I was presenting some of our current research. He found our work very interesting and invited us to run our next set of simulations on their new computer, Niagara, after it was built, giving us full access to the computer as early users.”
Niagara, Pleiades, and Electra1 are comparable in size (in terms of CPU core count), but Niagara was built by Lenovo and is powered by Intel Xeon Scalable Processors. Electra1 hosts Intel CPUs from a generation earlier.
“While SciNet is part of the University of Toronto,” said Dr. Daniel Gruner, SciNet’s Chief Technology Officer (CTO), “Niagara was built for academic research in all areas for use by researchers across Canada.”
The system is one of several that were funded by the Canada Foundation for Innovation and by Provincial Governments (Ontario and British Columbia) to build new supercomputers across the country. Others are sited at University of Victoria and Simon Fraser University, both in British Columbia, and University of Waterloo in Ontario. Niagara is the largest to date with about 60,000 cores.
“It takes up about half the space of our previous system,” added Dr. Gruner, “which is nine years old, uses two-thirds of the power, but it is about 10 times more powerful. Everyone was excited about the new addition. When it was announced to be built, we had researchers immediately asking when it would be ready.”
Niagara gave Professor Arbic and Dr. Menemenlis the level of computing they would need for their higher resolution model runs. They spent several days in late February to early March of 2018 running their calculations. That was just a couple of months ago.
“We’ve barely started to look at the results,” stated Professor Arbic. “We have a lot of analysis of the data yet to do. But, we have found that the internal gravity wave field has become more realistic in our models. We are seeing more of the spectrum and being able to more closely model the wider spectra of waves. The Toronto machine allows us to do simulations at such high resolution that we’re getting closer to using these simulations to understand how waves break in the real ocean.”
For Dr. Menemenlis, the results will not only help NASA to plan SWOT and other future oceanographic missions that require researchers to understand how internal wave signals appear in satellite data, but what the data mean. “The better we understand small-scale ocean processes, the better we’ll understand ocean circulation and climate. It can give future generations better tools to more accurately predict things like weather and how human behaviors affect the life support systems of our planet.”
You can find out more about Niagara here. Learn about Compute Canada here. Read more about Professor Arbic’s and Dr. Menemenlis’ work from the following: Professor Arbic’s website: https://arbic.earth.lsa.umich.edu/ Professor Arbic’s detail on global internal gravity wave modeling: https://arbic.earth.lsa.umich.edu/research/global-modeling-of-internal-tides-and-the-internal-gravity-wave-continuum/
SWOT website: https://swot.jpl.nasa.gov/
ECCO website: https://ecco.jpl.nasa.gov
Ken Strandberg is a technical story teller. He writes articles, white papers, seminars, web-based training, video and animation scripts, and technical marketing and interactive collateral for emerging technology companies, Fortune 100 enterprises, and multi-national corporations. Mr. Strandberg’s technology areas include Software, HPC, Industrial Technologies, Design Automation, Networking, Medical Technologies, Semiconductor, and Telecom. He can be reached at [email protected].
This article was produced as part of Intel’s HPC editorial program, with the goal of highlighting cutting-edge science, research and innovation driven by the HPC community through advanced technology. The publisher of the content has final editing rights and determines what articles are published.