Yield losses due to airborne molecular contamination (AMC) issues started to emerge in semiconductor manufacturing over 20 years ago.1 At that time, contamination monitoring was typically conducted by manually pulling air samples through a bubbler or impinger. Then, the samples would be taken to a chemical analysis laboratory to determine the content. This process is labor intensive, and it can take days to obtain a result. Samples were usually collected as a reactive measure to determine the cause of yield problems or as part of a monthly or quarterly monitoring program.
In the 1990s, automated monitoring systems based on ion mobility spectrometry (IMS) and other technologies became available. These systems were designed to monitor continuously and required little labor to operate and maintain. The complexity and cost of these systems made it impractical to install one analyzer system for each monitoring location. The analyzer systems were almost always coupled with a sequential sampling manifold system. This allowed as many as 60 locations to be monitored daily by a single analyzer system and represented an improvement in measurement coverage over manual sampling techniques.
Manifold sampling systems cycle through multiple monitoring locations, providing a brief measurement of each location, without regard to the relative importance of monitoring AMC at each location. As clean manufacturing has advanced and increasingly cleaner environments have been required for certain manufacturing processes, it has become clear that not every location in the cleanroom has the same risk level regarding molecular contamination. High risk areas are those areas where sensitive products or processes are exposed or where there is a risk of molecular contamination generation that can lead to significant yield loss. Lower risk areas are non-critical process areas and background monitoring. The identification of high risk areas and the impact AMC can have, has led to an emerging need for continuous monitoring of these critical locations.
While the large manifold systems of the past provided better monitoring coverage than manual sampling techniques, they still left each location unmonitored for more than 99% of each day (Figure 1). The few minutes of monitoring time per day are not always representative of the entire day and missed contamination events made it difficult to diagnose molecular contamination issues which can be transient.

TECHNOLOGY BEHIND AN OPTIMIZED MONITORING SOLUTION
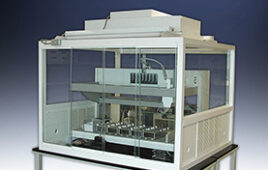
To meet the demand for continuous monitoring of critical locations, a new ion mobility spectrometer has been designed.2 In the design process, previous analyzer technologies were studied to understand their strengths and weaknesses to identify areas where significant improvements could be made. The result of this process is a simple, compact spectrometer with no valves, pumps, or other moving parts and a minimum of exposed surface area between the sample location and the measurement cell. IMS analyzers are atmospheric pressure, time-of-flight spectrometers which separate molecular ions based on their size and weight. IMS molecular monitors are used for monitoring airborne bases such as ammonia and amines and for monitoring airborne acids such as HF, HCl, SO2, formic, acetic, Cl2, etc. with detection limits of less than 70 parts-per-trillion.
This core technology can also be integrated into a multi-analyzer system with a 16 or 30 point manifold to provide lower cost monitoring of non-critical locations while minimizing the negative effects of large manifold sampling systems. It can also be used as part of a portable monitoring cart for troubleshooting AMC events in the cleanroom.
IMPLEMENTING AN OPTIMIZED MONITORING SYSTEM
In clean manufacturing environments, locations are often divided into critical and non-critical categories. Examples of critical locations are: inside of photolithography exposure and track tools where exposure to ammonia and acids can lead to T-topping and optical contamination; the lithography bay; the wafer environment; the reticle environment; and potential contamination source areas such as make-up air, etch process area; CMP; and wet clean benches. 3,4
Non-critical contamination areas are typically cleanroom environmental monitoring and return air monitoring. Contamination levels in these areas do not have as direct of an impact on products and processes, but can be indicative of general cleanroom cleanliness and provide an understanding of chemical filter loading. Left unchecked, high levels of contamination in non-critical areas will migrate into critical areas over time whether it is through diffusion into wafer and reticle pods or migration through chemical filters.
The important parameters to consider when implementing a monitoring system are presented in Table 1. The manifold systems are assumed to have a 15 minute sample cycle comprised of a 10 minute purge and 5 minute sample.

(Click Image For A Larger Version)
Average time sampling each location per day
This describes how well the system will perform detecting transient events. A low percentage value means that events can easily be missed.
Typical sample line lengths
Sample tubing transport effects can make it difficult to accurately measure low concentrations of molecular contamination. The longer the sample tubing line length the greater the surface area with which the air sample will interact. This is especially true for old tubing that has accumulated particulate contamination —PTFE and PFA tubing is very effective in electrostatically trapping particulate contamination. Large multipoint manifold systems can have very long sample line lengths because one system is typically responsible for monitoring an entire cleanroom. If multiple 16 point manifold systems are used in a cleanroom, the sample line lengths are reduced to about 25–35% of the tubing lengths necessary for a 60 point system.
Time to capture data
This is perhaps the most important parameter for maintaining a clean, controlled environment in critical process areas. A common threshold to determine if the environment is stable and in control, or if contamination is increasing, is to detect when four out of five consecutive samples are more than two sigma above the long-term, mean concentration. Looking at the time to measure five consecutive samples in Table 1, the value of continuous monitoring in ensuring that critical sample locations are consistently clean is clear. Deviations from a controlled, clean environment are rapidly detected using continuous monitoring. Additionally, continuous monitoring will detect every contamination event and will show exactly when the contamination event occurred.
Continuous monitoring is ideal in critical areas where contamination events need to be identified immediately and where the time signature of the contamination event can often be used to correlate the event with process changes, wafer lots, maintenance actions, or other human activities. Monitoring non critical areas of the cleanroom with a manifold system provides data to track longer term molecular contamination trends over the course of hours and days, but is not well suited for transient event detection.
Troubleshooting
When a contamination event is detected by manual sampling, manifold sampling, or continuous monitoring, the troubleshooting process begins. Where is the contamination coming from and which chemical species are present? Spatial identification of the contamination source is best accomplished with a mobile monitoring system. A mobile monitoring system offers the advantage of being able to quickly relocate the AMC analyzers to multiple locations to find a contamination source. Once the contamination source has been located, the chemical species causing the contamination event may be obvious. If it is not obvious, laboratory analysis techniques can be used to analyze air samples collected in sorbent tubes or impingers.

(Click Image For A Larger Version)
SUMMARY
As shown in Table 2, a combination of continuous and periodic monitoring systems can provide the data necessary to ensure that critical locations are consistently clean while providing a measurement of the stability and quality of non-critical clean environments. Mobile AMC monitoring systems reduce troubleshooting time significantly by allowing rapid investigation of contamination events.
References
- MacDonald, Scott A.; Clecak, Nicholas J.; Wendt, H.R.; Wilson, C. Grant; Snyder, Clinton D.; Knors, C.J.; Deyoe, N.B.; Maltabes, John G.; Morrow, James R.; McGuire, Anne E.; Holmes, Steven J.; “Airborne Chemical contamination of a Chemically Amplified Resist”, SPIE, Advances in Resist Technology and Processing VIII, vol. 1446, (1991), 2-12.
- Rodier, Dan; Rowley, Steven; “Optimized AMC Monitoring for Lithography”, Solid State Technology, Dec 2007.
- Avary, Kamran; Feicke, Axel; Cantrell, Rusty; “Amine Contamination Monitoring and Control at the Advanced Mask Center”, European Mask and Lithography Conference 2005.
- Kambara, Hisanori; Favre, Arnaud; Davenet, Magali; Rodier, Dan; “Airborne Molecular Contamination Detection Method for Photomasks and Ultra Purging Decontamination”, SPIE, Photomask and Next Generation Lithography Mask Technology XVI, Proc. Of SPIE Vol 7379, (2009) 73791G.
Dan Rodier, Ph.D. is Technology Development Manager for Particle Measuring Systems. He has over 20 years experience in airborne molecular monitoring. Particle Measuring Systems, 5475 Airport Blvd., Boulder, CO 80301; (303) 443-7100; [email protected]; www.pmeasuring.com.