Research & Development World

  • R&D World Home
  • Topics
    • Aerospace
    • Automotive
    • Biotech
    • Careers
    • Chemistry
    • Environment
    • Energy
    • Life Science
    • Material Science
    • R&D Management
    • Physics
  • Technology
    • 3D Printing
    • A.I./Robotics
    • Software
    • Battery Technology
    • Controlled Environments
      • Cleanrooms
      • Graphene
      • Lasers
      • Regulations/Standards
      • Sensors
    • Imaging
    • Nanotechnology
    • Scientific Computing
      • Big Data
      • HPC/Supercomputing
      • Informatics
      • Security
    • Semiconductors
  • R&D Market Pulse
  • R&D 100
    • Call for Nominations: The 2025 R&D 100 Awards
    • R&D 100 Awards Event
    • R&D 100 Submissions
    • Winner Archive
    • Explore the 2024 R&D 100 award winners and finalists
  • Resources
    • Research Reports
    • Digital Issues
    • Educational Assets
    • R&D Index
    • Subscribe
    • Video
    • Webinars
  • Global Funding Forecast
  • Top Labs
  • Advertise
  • SUBSCRIBE

Americans Use More Clean Energy in 2016

By DOE/Lawrence Livermore National Laboratory | April 11, 2017

Americans used more renewable energy in 2016 compared to the previous year, according to the most recent energy flow charts released by Lawrence Livermore National Laboratory. Overall, energy consumption was nearly flat.

Each year, the Laboratory releases energy flow charts that illustrate the nation’s consumption and use of energy. Americans used 0.1 quads (quadrillion BTU), more in 2016 than in 2015. A BTU, or British Thermal Unit, is a unit of measurement for energy; 3,400 BTU is equivalent to about 1 kilowatt-hour.

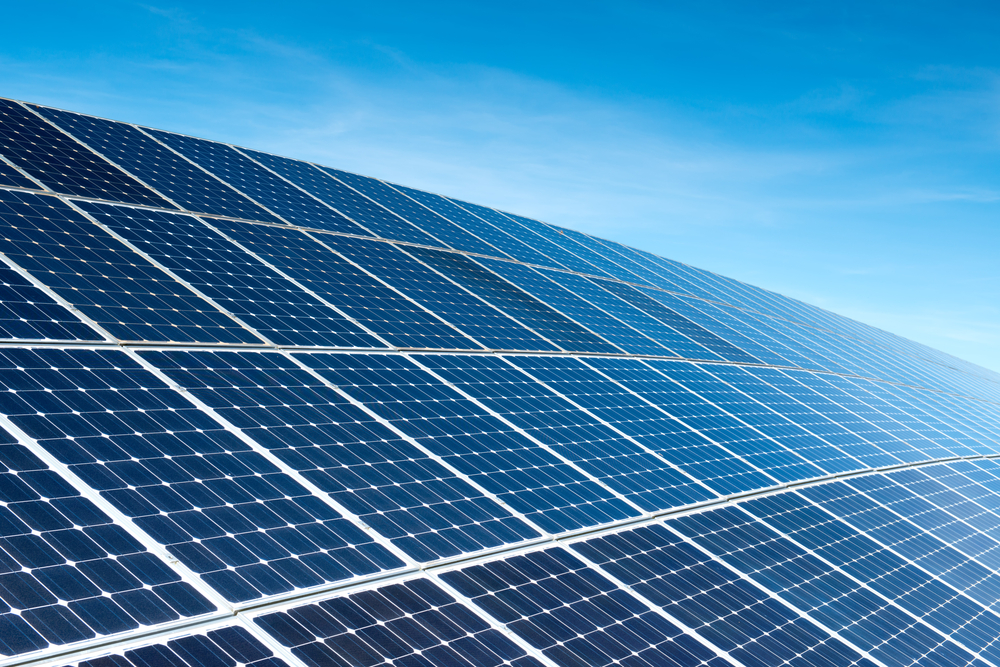
Prices for photovoltaic panels have fallen dramatically over the past decade, contributing to solar energy’s rapid growth, which rose by 0.15 quads or 38 percent in 2016, with significant additions in the electricity, commercial and residential sectors. “Two thirds of that increase was in the electric sector,” said A.J. Simon, group leader for LLNL’s energy program. “These are large installations of thousands of solar panels, usually in the desert.” Installations on the roofs of homes and warehouses account for the rest of the additions.

Likewise, more wind power is contributing to the nation’s utility grid. Use of wind power rose by 19 percent or 0.33 quads. “Generous incentives for renewable energy, combined with improved ‘know-how’ in siting and building wind farms, has led to a favorable environment for growth in this sector,” Simon said.

Coal use decreased by 9 percent to 14.2 quads, mostly due to decreased coal supply to the electricity sector. That supply has been replaced by wind, solar and natural gas. Overall, natural gas use rose by 1 percent to 28.5 quads.

Energy use in the residential, commercial and industrial sectors all declined slightly, while consumption of fossil fuels in the transportation sector rose by 0.5 quads or 2 percent.

All energy use results in some losses, shown on the charts as rejected energy. This energy most often takes the form of waste heat, such as the warm exhaust from automobiles and furnaces. The efficiency of the nation’s cars, lightbulbs and factories determines how much waste heat is produced, and how much of fuel and electricity can be put to productive use.

This year marks two changes to the energy flow chart. The Energy Information Administration has changed the way it analyzes and reports renewable energy use, and those changes are reflected in the 2016 chart as well as a revision to the 2015 analysis. Additionally, the estimate of efficiency of the industrial sector has been reduced from 80 percent to 49 percent to align with recent analysis at the DOE’s Advanced Manufacturing Office. LLNL reports all year-over-year changes on a basis consistent with the new methodology.

Related Articles Read More >

Google invests in fusion energy as the company’s energy use keeps climbing
Plastic converted into clean energy
New 10,000 square-foot plasma research center in Princeton, NJ
2025 R&D layoffs tracker hits 132,075 as Amazon CEO signals AI will cut more jobs
rd newsletter
EXPAND YOUR KNOWLEDGE AND STAY CONNECTED
Get the latest info on technologies, trends, and strategies in Research & Development.
RD 25 Power Index

R&D World Digital Issues

Fall 2024 issue

Browse the most current issue of R&D World and back issues in an easy to use high quality format. Clip, share and download with the leading R&D magazine today.

Research & Development World
  • Subscribe to R&D World Magazine
  • Enews Sign Up
  • Contact Us
  • About Us
  • Drug Discovery & Development
  • Pharmaceutical Processing
  • Global Funding Forecast

Copyright © 2025 WTWH Media LLC. All Rights Reserved. The material on this site may not be reproduced, distributed, transmitted, cached or otherwise used, except with the prior written permission of WTWH Media
Privacy Policy | Advertising | About Us

Search R&D World

  • R&D World Home
  • Topics
    • Aerospace
    • Automotive
    • Biotech
    • Careers
    • Chemistry
    • Environment
    • Energy
    • Life Science
    • Material Science
    • R&D Management
    • Physics
  • Technology
    • 3D Printing
    • A.I./Robotics
    • Software
    • Battery Technology
    • Controlled Environments
      • Cleanrooms
      • Graphene
      • Lasers
      • Regulations/Standards
      • Sensors
    • Imaging
    • Nanotechnology
    • Scientific Computing
      • Big Data
      • HPC/Supercomputing
      • Informatics
      • Security
    • Semiconductors
  • R&D Market Pulse
  • R&D 100
    • Call for Nominations: The 2025 R&D 100 Awards
    • R&D 100 Awards Event
    • R&D 100 Submissions
    • Winner Archive
    • Explore the 2024 R&D 100 award winners and finalists
  • Resources
    • Research Reports
    • Digital Issues
    • Educational Assets
    • R&D Index
    • Subscribe
    • Video
    • Webinars
  • Global Funding Forecast
  • Top Labs
  • Advertise
  • SUBSCRIBE