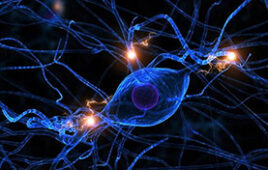
This graphic depicts the top 0.25 percent of the relationships that the researchers’ techniques found in data on the concentration of microbes in the human gut. Image: David Reshef |

The
information age is also the age of information overload. Companies,
governments, researchers, and private citizens are accumulating digital data at
an unprecedented rate, and amid all those quintillions of bytes could be the
answers to questions of vital human interest: What environmental conditions
contribute most to disease outbreaks? What sociopolitical factors contribute
most to educational success? What player statistics best predict a baseball
team’s win-loss record?
There
are a host of mathematical tools for finding possible relationships among data,
but most of them require some prior knowledge about what those relationships
might be. The problem becomes much harder if you start with a blank slate, and
harder still if the datasets are large. But that’s exactly the problem that
researchers at the Massachusetts Institute of Technology (MIT), Harvard University, and the Broad Institute
tackle in a paper in Science.
David
Reshef, a joint MD-PhD student in the Harvard-MIT Division of Health Sciences
and Technology (HST)—who, along with his brother, Yakir, is lead author on the
new paper—says his team’s approach to data mining tries to maximize two
properties that are often in conflict; he calls these generality and
equitability.
The
graph of the relationship between two variables in a dataset could take any
shape: For a company’s hourly employees, the graph of hours worked to wages
would approximate a straight line. A graph of flu incidence versus time,
however, might undulate up and down, representing familiar seasonal outbreaks,
whereas adoption of a new technology versus time might follow a convex curve,
starting off slowly and ramping up as the technology proves itself. An algorithm
for mining large datasets needs to be able to recognize any such relationship;
that’s what Reshef means by generality.
Equitability
is a little more subtle. If you actually tried to graph workers’ hours against
wages, you probably wouldn’t get a perfectly straight line. There might be some
overtime hours at higher wages that throw things off slightly, or Christmas
bonuses, or reimbursement for expenses. In engineers’ parlance, there could be
noise in the signal. Most data-mining algorithms score possible relationships
between variables according to their noisiness; the noisier the relationship,
the less likely that it represents a real-world dependency. But linear
relationships, undulating relationships or curved relationships with the same
amount of noise should all score equally well. That’s equitability.
As
it happens, most previous attempts to create general data-mining algorithms
have tended to privilege some relationships over others. So, for instance, a
very noisy linear relationship might receive the same score as a nearly
noiseless undulating relationship, making it difficult to interpret the
algorithm’s output.
On the grid
Reshef holds both a bachelor’s and a master’s from MIT, but while both degrees
are in computer science, for his master’s thesis he chose to work with Pardis
Sabeti, an assistant professor of biology at Harvard and a member of Harvard
and MIT’s joint Broad Institute. “I had started trying to think about some
large epidemiological datasets, and since I wasn’t an epidemiologist, I didn’t
really know what to look for,” Reshef says. “I just kind of wanted to know, ‘What are the variables in these datasets that are most associated?’ Being as
naïve as I was, I hadn’t quite realized how difficult of a question that was to
answer.” Once he realized the scale of the problem, “I roped my brother”—then
an undergraduate math major at Harvard—”in to help me.”
Reshef’s
eight co-authors on the Science paper include not only his brother,
Sabeti, and Michael Mitzenmacher, a Harvard professor of computer science, but
also colleagues from Oxford University in the U.K.
(where Reshef was a Marshall Scholar), the Broad Institute and the Weizmann
Institute in Israel,
where Yakir is now a Fulbright Scholar.
The
procedure that their algorithm follows can be interpreted visually.
Effectively, the algorithm considers every pair of variables in a dataset and
plots them against each other. It then overlays each graph with a series of
denser and denser grids and identifies the grid cells that contain data points.
Using principles borrowed from information theory, the algorithm assesses how
orderly the patterns produced by the data-containing cells are. The score for each
pair of variables is based on the score of its most orderly pattern.
“The
fundamental idea behind this approach is that if a pattern exists in the data,
there will be some gridding that can capture it,” Reshef says. And because the
cells in a grid can track a curve as easily as they can a straight line, the
method isn’t tied to any particular type of relationship.
The
problem that Reshef and his colleagues have tackled “is a very important
problem,” says Eli Upfal, a professor of computer science at Brown University,
and the researchers’ algorithm “looks like a very novel and a very interesting
approach.”
“Most
of the analysis [of relationships between data] assumes some model, and a big
chunk of the work assumes linear models,” Upfal says. “What we have here now is
a technique that is independent of any assumptions about the data.”
Upfal
cautions that “the proof will be to what extent scientists really adopt this
approach, and that will take some time to see.” But, he says, “for the initial
paper presenting a new technique, it definitely looks great.”