The path to an application-specific camera.
|
The power of multispectral imaging is already leveraged in a wide variety of research applications. Multispectral images are data-rich, revealing things beyond our human vision by combining ultraviolet (UV) fluorescence, narrow-band color and penetrating near-infrared (NIR) images. However, until recently, there has not been a feasible way to scale this technology for production-volume portable devices or high-speed inspection in specific commercial and industrial applications.
Here we explore a step-wise development path and tools to go from the research phase to scalable production for multispectral inspection.
Define spectral bands of interest
The fine spectral resolution of spectroscopy and hyperspectral data show valuable insights regarding the spectral contrast of a sample material in different conditions. After evaluation of an extensive data cube of wavelengths, locations and time, the data reveal that processing three to eight precisely located spectral bands often delivers the desired contrast. The goal at this point is to use a cost-effective and readily available instrument to define the locations and widths of the ideal spectral bands.
Use of a spectrometer to evaluate the target objects or materials lets researchers find spectral deltas between the target and the surrounding background. Each application is unique, so regions from the UV through short-wave infrared (SWIR) may be of interest. Both the position and the width of relevant spectral bands should be identified. The spectrometer scan in Figure 1 shows the spectral difference between an organic material and its inorganic replica. In this case the materials are virtually identical in visible wavelengths, but in the SWIR have distinct and detectable differences between 1,400 to 2,200 nm. Based on ratios between spectra, the most significant contrasts for these materials are first in the 1,900 to 2,000 nm range, and second in the 1,400 to 1,450 nm range. Using this spectroscopy approach, users can identify the three to eight key spectral bands that differentiate the target from the background in the application setting.
![]() Optimize multispectral images
Optimize multispectral images
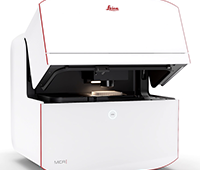
After defining the spectral bands of interest, the next step is to optimize images with the precise spectral bands of interest for an application. A simple economical method uses a versatile integrated filter wheel camera such as Pixelteq’s, Golden, Colo., SpectroCam multispectral camera pictured in Figure 2. Such a system provides imaging beyond traditional RGB color cameras with the flexibility to “see” specific wide and narrow bands in the NIR, SWIR, visible and UV ranges, depending on the camera sensor. Bandpass filters across these ranges can typically be designed with bandwidths ranging from 5 to 100 nm. Starting with bandpass filters that approximate the spectral bands identified earlier, the user can evaluate the spectral contrast, interchanging filters as necessary to optimize the contrast and images for the interdependent effects of spectral bands, scene illumination, sensor response and integration times. Some light-emitting diode (LED) and arc lamp “white” light sources emit spectra ranging from multiple narrow bands to spikey broadband light; users should ensure sufficient light is available in the spectral bands being imaged.
Beyond visual evaluation of raw sequential images, software bundled with integrated multispectral cameras can be used to help enhance contrast.
Real-time application
Real-world applications with moving objects benefit from all spectral channels being imaged simultaneously instead of sequentially. After optimizing spectral bands, application-specific cameras can be scaled to production using a proprietary technology to micropattern a passive dichroic filter array onto camera sensors. This approach delivers simultaneous “snapshot” multispectral imaging at the native frame rate of the sensor. As performed in traditional color camera sensors, the individual spectral channels are de-mosaiced in software with each channel providing an image of the field of view.
In addition to area sensors, this multispectral technology is applied to line-scan cameras for applications from production inspection to remote sensing. Volume production of such application-specific cameras is cost-effective and proves relevant to industrial applications where dedicated inspection is required.
In addition, the dichroic filter arrays are passive and integrated, so requirements for a multispectral camera are the same as the base monochrome camera.