Research & Development World

  • R&D World Home
  • Topics
    • Aerospace
    • Automotive
    • Biotech
    • Careers
    • Chemistry
    • Environment
    • Energy
    • Life Science
    • Material Science
    • R&D Management
    • Physics
  • Technology
    • 3D Printing
    • A.I./Robotics
    • Software
    • Battery Technology
    • Controlled Environments
      • Cleanrooms
      • Graphene
      • Lasers
      • Regulations/Standards
      • Sensors
    • Imaging
    • Nanotechnology
    • Scientific Computing
      • Big Data
      • HPC/Supercomputing
      • Informatics
      • Security
    • Semiconductors
  • R&D Market Pulse
  • R&D 100
    • 2025 R&D 100 Award Winners
    • 2025 Professional Award Winners
    • 2025 Special Recognition Winners
    • R&D 100 Awards Event
    • R&D 100 Submissions
    • Winner Archive
  • Resources
    • Research Reports
    • Digital Issues
    • Educational Assets
    • R&D Index
    • Subscribe
    • Video
    • Webinars
    • Content submission guidelines for R&D World
  • Global Funding Forecast
  • Top Labs
  • Advertise
  • SUBSCRIBE

NASA Satellite Sees Heavy Rain in Tropical Depression Bonnie

By Nasa/Goddard Space Flight Center | June 3, 2016

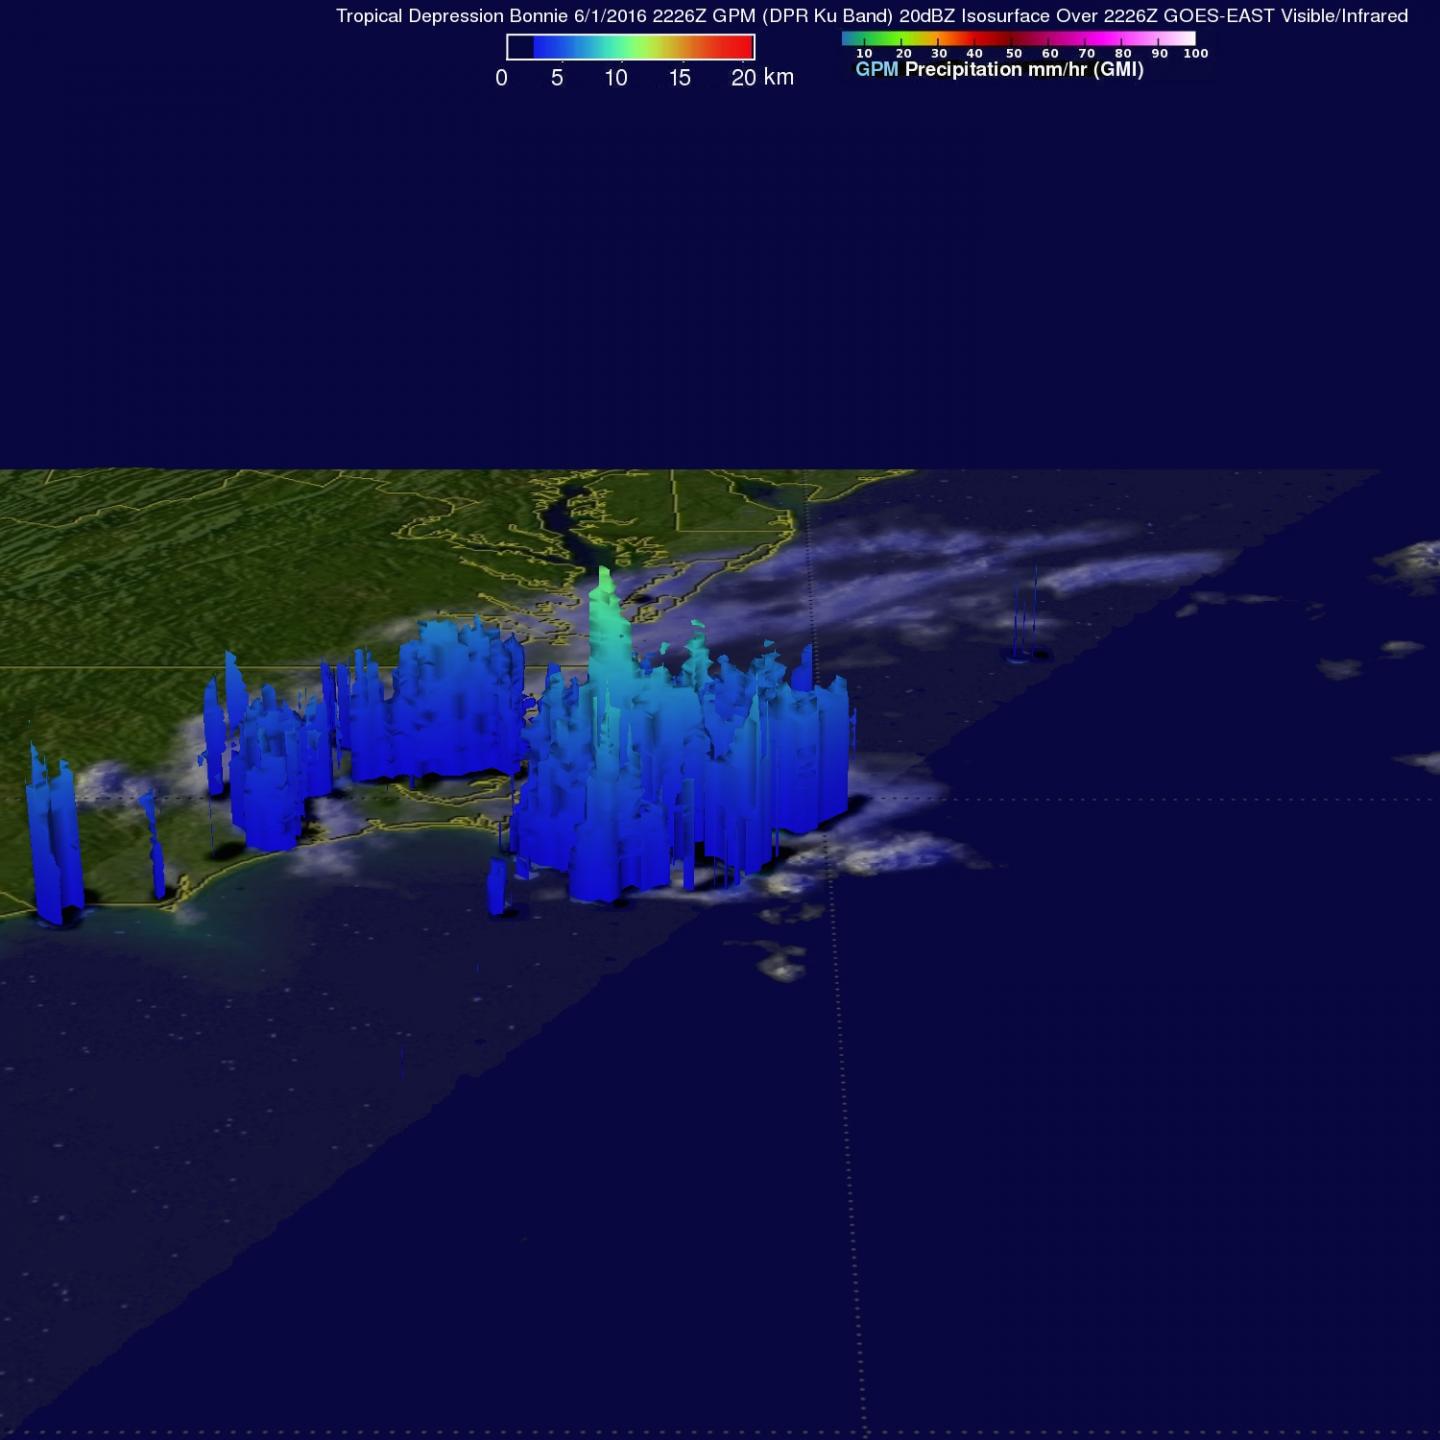
On June 1, 2016, NASA/JAXA’s GPM core satellite found rainfall from a few powerful convective thunderstorms falling at a rate of almost 4.9 inches (124 mm) per hour and storm top heights of more than 9.3 miles (15 km). Source: NASA/JAXA/Hal Pierce

The Global Precipitation Measurement mission known as GPM passed over Tropical Depression Bonnie and found heavy rainfall from a few thunderstorms within.

Tropical Storm Bonnie weakened to a tropical depression on May 29, 2016. The circulation was labeled as “post-tropical” and has been moving very slowly to the northeast near the Carolinas coastline. Bonnie developed organized convection near the center and on June 2, 2016 the system was again labeled a tropical depression.

The GPM Core Observatory satellite saw Tropical Depression Bonnie on June 1, 2016, at 6:26 p.m. EDT (22:26 UTC). GPM’s Microwave Imager (GMI) and Dual-Frequency Precipitation Radar (DPR) instruments measured precipitation in a few powerful convective thunderstorms falling at a rate of almost 4.9 inches (124 mm) per hour. Storm top heights of more than 9.3 miles (15 km) were found by GPM’s Radar (Ku Band). GPM is a joint mission between NASA and the Japan Aerospace Exploration Agency (JAXA).

On June 3, 2016 the National Hurricane Center (NHC) noted that although Bonnie is pulling away from the U.S. East Coast, dangerous surf conditions are still possible along portions of the North Carolina coast, including the Outer Banks, through today. There are no coastal watches or warnings in effect.

At 5 a.m. EDT (9:00 UTC) on June 3, 2016 the center of Tropical Depression Bonnie was located near 35.8 degrees north latitude and 73.3 degrees west longitude. That puts the center about 130 miles (210 km) east-northeast of Cape Hatteras, North Carolina.

The NHC said that depression was moving toward the east-northeast near 8 mph (13 kph), and a turn toward the east with increasing forward speed is expected over the next 48 hours. Maximum sustained winds are near 35 mph (55 kph) with higher gusts. NHC said that some strengthening is possible today, and Bonnie could again become a tropical storm. Weakening should begin by tonight, however, and Bonnie is forecast to become a post-tropical cyclone on Saturday. The estimated minimum central pressure is 1,006 millibars.

By June 4, 2016, increased vertical shear and colder sea surface temperatures are expected to cause Bonnie to again weaken to post-tropical remnants.

Related Articles Read More >

Oak Ridge National Laboratory’s Olivera Kotevska on PRESTO and Her R&D 100 Win
NASA R&D 100 Winner enables high-speed data transfer from space
Lab automation is “vaporizing”: Why the hottest innovation is invisible
Google on how AI will extend researchers
rd newsletter
EXPAND YOUR KNOWLEDGE AND STAY CONNECTED
Get the latest info on technologies, trends, and strategies in Research & Development.
RD 25 Power Index

R&D World Digital Issues

Fall 2025 issue

Browse the most current issue of R&D World and back issues in an easy to use high quality format. Clip, share and download with the leading R&D magazine today.

R&D 100 Awards
Research & Development World
  • Subscribe to R&D World Magazine
  • Sign up for R&D World’s newsletter
  • Contact Us
  • About Us
  • Drug Discovery & Development
  • Pharmaceutical Processing
  • Global Funding Forecast

Copyright © 2026 WTWH Media LLC. All Rights Reserved. The material on this site may not be reproduced, distributed, transmitted, cached or otherwise used, except with the prior written permission of WTWH Media
Privacy Policy | Advertising | About Us

Search R&D World

  • R&D World Home
  • Topics
    • Aerospace
    • Automotive
    • Biotech
    • Careers
    • Chemistry
    • Environment
    • Energy
    • Life Science
    • Material Science
    • R&D Management
    • Physics
  • Technology
    • 3D Printing
    • A.I./Robotics
    • Software
    • Battery Technology
    • Controlled Environments
      • Cleanrooms
      • Graphene
      • Lasers
      • Regulations/Standards
      • Sensors
    • Imaging
    • Nanotechnology
    • Scientific Computing
      • Big Data
      • HPC/Supercomputing
      • Informatics
      • Security
    • Semiconductors
  • R&D Market Pulse
  • R&D 100
    • 2025 R&D 100 Award Winners
    • 2025 Professional Award Winners
    • 2025 Special Recognition Winners
    • R&D 100 Awards Event
    • R&D 100 Submissions
    • Winner Archive
  • Resources
    • Research Reports
    • Digital Issues
    • Educational Assets
    • R&D Index
    • Subscribe
    • Video
    • Webinars
    • Content submission guidelines for R&D World
  • Global Funding Forecast
  • Top Labs
  • Advertise
  • SUBSCRIBE