By Steve Tally

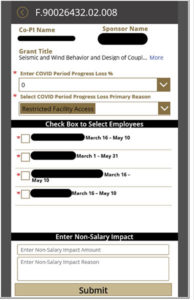
Purdue University has collaborated with Microsoft to develop a software tool that allows university administrators to track the effects of COVID-19 on research activities. The user-friendly tool is based on Microsoft Power BI. (Purdue University image.)
Much attention has been focused on how universities moved quickly from in-person classes to online instruction at the onset of the coronavirus pandemic. However, research experiments and activities requiring on-campus laboratories and field sites across the state and the world were arguably disrupted even more.
To measure and document the level of disruption, Purdue University and Microsoft are collaborating on a tool that allows campus researchers to input information about how specific sponsored programs have been affected. It then provides an aggregated view of financial impact.
Purdue is calling the tool the “COVID-19 Sponsored Program Impact Application.” It combines the business intelligence application Microsoft Power BI with a user-friendly interface developed using Power Apps. Purdue researchers can access the application through Microsoft Teams.
The application is pre-populated with sponsored program data such as payroll and level-of-effort information. Each principal investigator is presented with a custom dashboard that presents their portfolio of sponsored programs. For each project, the researcher can indicate the lost progress toward project goals and deliverables for each member of the research team. This information is aggregated to measure the financial impact for each grant.
Theresa Mayer, Purdue’s executive vice president for research and partnerships, said the modified tool has allowed researchers to quickly conduct an assessment.
“At this point, we have more than 1,100 faculty members on campus using the tool, and it is allowing us to get a clearer picture of how the COVID-19 event has affected our research programs,” she said. “Until now, we have not been able to quantify impact at the research project level this efficiently.
“The program also allows researchers to indicate which researchers were reassigned to work on specific COVID-19 research projects so those efforts can be understood as well.”
Anthony Salcito, vice president of education for Microsoft, said the company works with higher education institutions to support and amplify their efforts to drive innovation.
“We are excited by the work we are doing with Purdue University to demonstrate the potential of our Power Platform to enable institutions to quickly gather and share the data insights they need to make the best decisions for their institutions.”
Ken Sandel, senior director of sponsored programs at Purdue, said the program allows his staff to get a better idea of the project-by-project impact so they are in a better position to respond to federal agencies’ specific questions and assist principal investigators in requesting project extensions or assessing supplemental funding needs due to lost progress.
“This type of data was previously available only by developing models and forecasting the impact. The tool allows for a quantitative assessment prepared by those most affected,” Sandel said. “We have already used the data to see that a number of projects were unaffected by stay-at-home orders. Many are computational in nature and could be accomplished from home, while others required access to laboratory equipment, so their efforts were more significantly affected.
“We would like to understand the impact of COVID-19 on our sponsored programs, and this tool allows us to do that without enormous effort.”
As Purdue and Microsoft continue to refine the tool, the expectation is that it will soon be available for other universities to use as well. Additionally, Microsoft has plans to provide a similar but somewhat more limited version of the tool that would run in Microsoft SharePoint.
Purdue and Microsoft also worked with Mazik Global, a Microsoft Certified Development Center, to rapidly deploy the solution and to train Purdue IT staff in order to support the software.
University administrators who would like more information about the tool should contact Carrie Berger, associate dean for research at Purdue, at [email protected].


Tell Us What You Think!