Unmanned aerial systems (UAS, or drones) are a rapidly evolving technology that is being used for a variety of applications. With federal regulations making it easier to operate these systems with appropriate commercial certification, the number of UAS pilots has greatly increased. Over the past eight years, the Michigan Tech Research Institute (MTRI) in Ann Arbor, Michigan has been investigating how UAS can be used to assist transportation managers in asset management, specifically in the assessment of unpaved roads, bridge deck conditions and traffic monitoring. Below, several of these research endeavors are highlighted.
Unpaved road assessment
Under a United States Department of Transportation project, MTRI conducted research on how to best deploy UAS to automatically detect and quantify unpaved road distresses, such as potholes, ruts, insufficient crown, and corrugation. A Michigan-made Bergen hexacopter, with an onboard Nikon D800 or D810 optical high-resolution full-frame camera, was flown along traffic-restricted stretches of road, automatically collecting regularly spaced images of the road and its distresses.
After data collection was complete, the imagery was processed through a customized workflow to generate a 3D point cloud and densified point cloud. Additional processing created a depth map to help determine the volume of distresses. A distress detection algorithm was effective at detecting and categorizing potholes and road crown into specific rating categories.
To verify the algorithms performance, ground truth was collected at each site at the same time of the UAS flights. It was determined that the analysis software was able to locate and categorize more road distresses than the ground crew.
A price analysis was conducted to determine how much could potentially be saved using UAS instead of manual methods to assess the condition of unpaved roads. Assuming that users are evaluating two 100 ft (30 m) segments per mile of road needing assessment, then costs can be as low as $0.74 per mile vs. similar costs of $7.58 per mile for manual methods (based on a Wyoming moderate distress estimate). These costs demonstrated that UAS-based sensing of unpaved road conditions can be done at reasonable financial rates that are promising for commercial adoption.
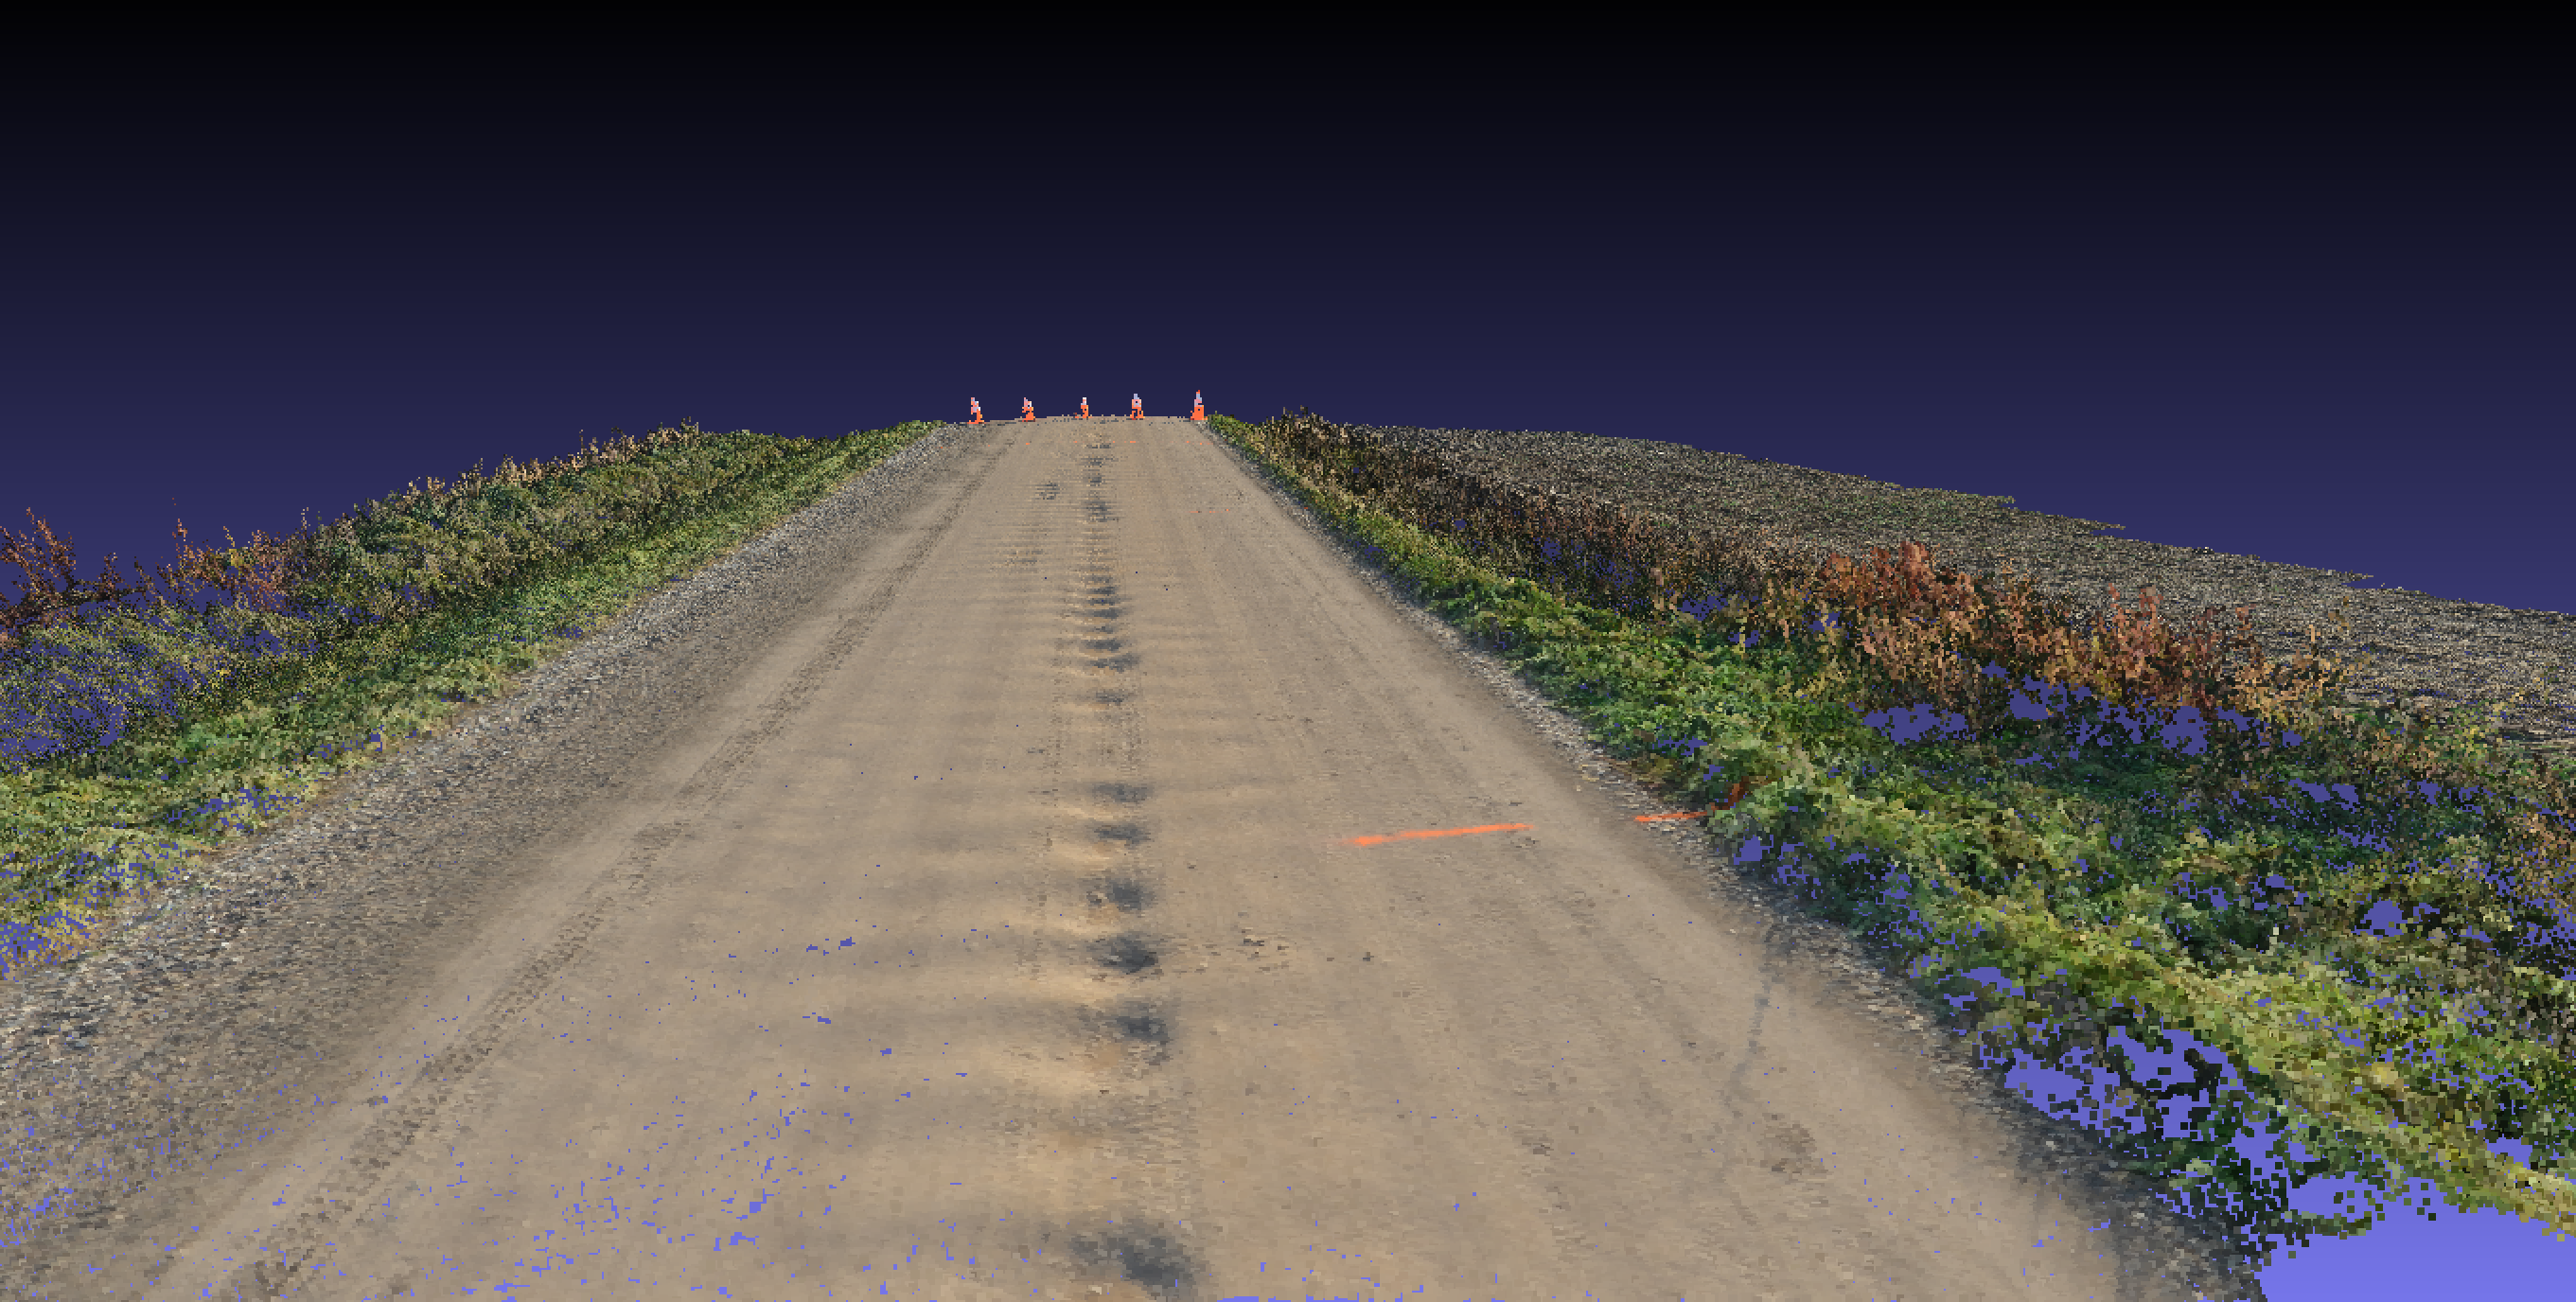
Examples of UAS-based geospatial outputs. A 3D point cloud generated by structure-from-motion using overlapping UAV-collected imagery. Credit: Michigan Tech Research Institute
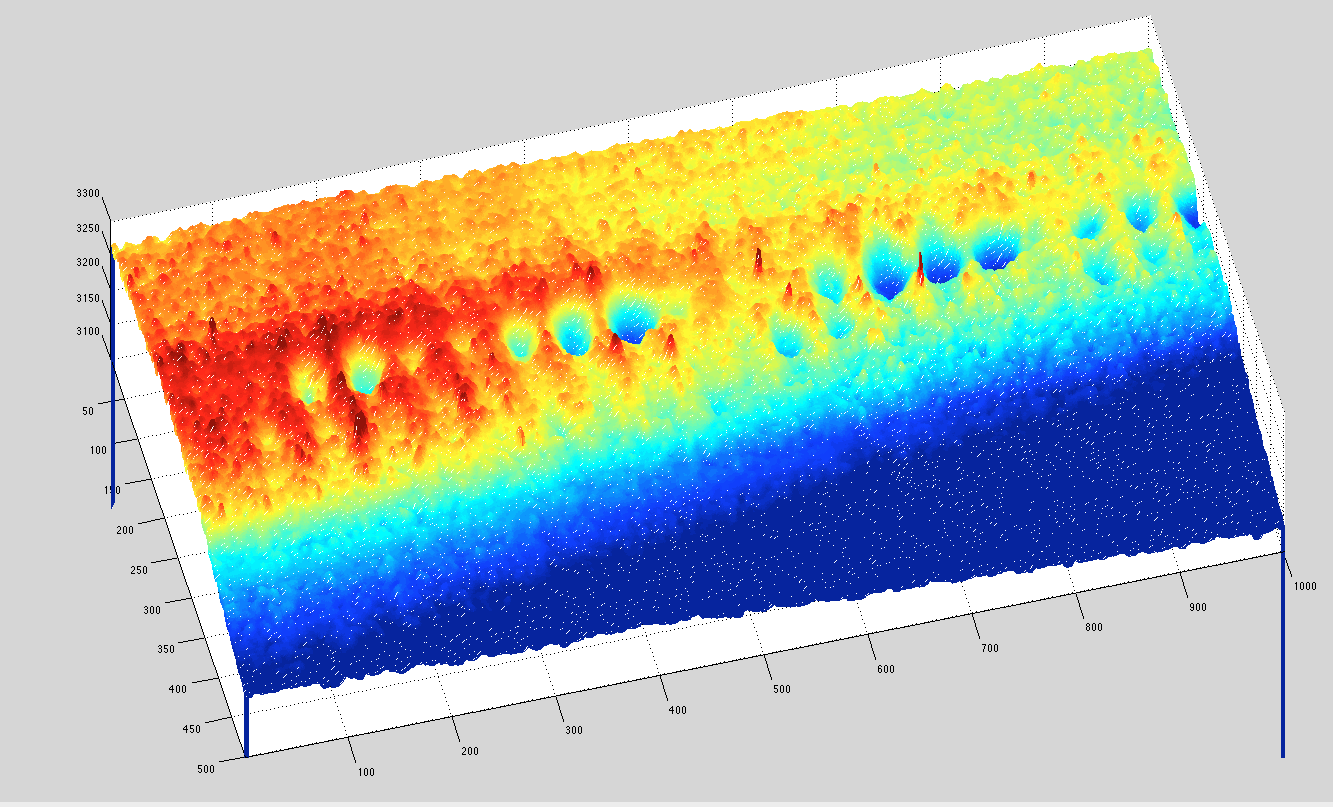
Examples of UAS-based geospatial outputs. A height map where potholes and their depths can be seen. Credit: Michigan Tech Research Institute
Bridge deck assessment
As part of a project consisting of two phases of research funded by the Michigan Department of Transportation (MDOT), MTRI assessed how UAS could monitor and automatically detect bridge deck spalls (potholes) using the optical high-resolution Nikon D810 and delaminations (voids within the bridge deck that are not visible) using a FLIR Tau thermal camera. At multiple sites, the Bergen Hexacopter was flown over bridge decks while collecting optical and thermal imagery during separate flights.
Using a commercial modeling software, the optical imagery was post-processed into a 3D point cloud and model to create a digital elevation models (DEMs). The DEM was processed through a custom spall detection algorithm that computed the difference in elevation between neighboring pixels. If the change in elevation was above a set threshold, the area was labeled as a potential spall. Each potential spall was added to an output geospatial file for further quantitative analysis and bridge deck condition documentation.
Similarly, the thermal imagery was processed through a custom algorithm to automatically detect temperature fluctuations that could be indicative of a delamination. Using statistics and a threshold value, any pixel that fell outside of a certain thermal boundary and did not have visible surface issues was labeled as a potential delamination and copied over to a resulting geospatial file.
Ground truth data was collected onsite on the same day as the UAS flights by trained bridge deck inspectors. These inspections were conducted in a similar method as compared to standard inspections, which use chain-dragging and hammer-sounding to aid in determining the extent of potential delaminations. When a delamination was detected, spray paint was used to mark out the boundaries. Upon completing the inspection, another UAS flight was conducted to collect optical imagery of the marked-up bridge deck for comparison against the algorithm outputs.
The resulting data products showed the ability to rapidly and accurately detect bridge deck surface and subsurface condition issues using UAS-collected imagery. The optical imagery was able to detect spalls that were also noted by the bridge inspectors. Similarly, the thermal imagery was also able to detect delaminations detected by the bridge inspectors, but at a finer level of detail. When inspectors draw delamination boundaries, the total area is marked as larger than the delamination areas to make sure that the entirety of the defect is removed during repair. The algorithm developed under this product was able to more precisely outline delamination boundaries based on the changes in thermal properties of the bridge deck.
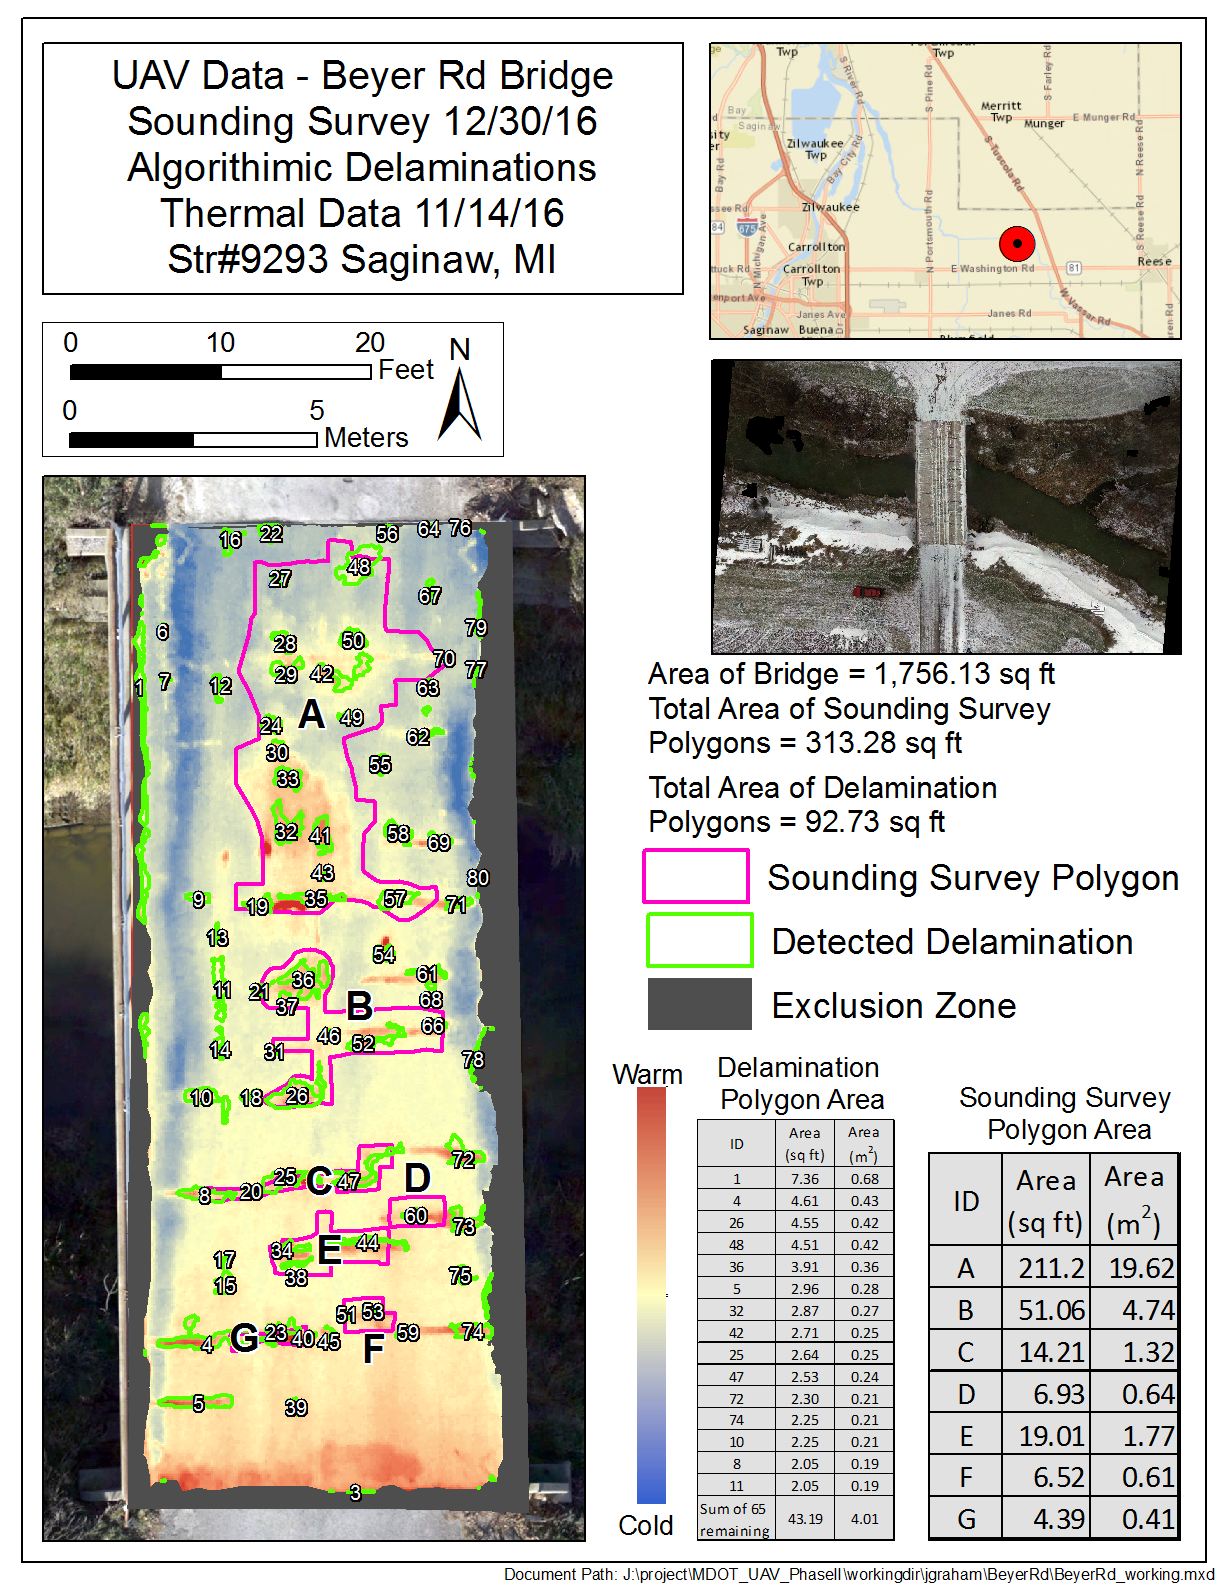
Examples of UAS-based geospatial outputs at Beyer Road Bridge. Left: The green polygons show likely delamination areas as detected by automated methods and the pink polygons are delamination marked by a MDOT bridge survey a month after the UAV thermal data collection. Right: the Beyer Road digital elevation model. Credit: Michigan Tech Research Institute
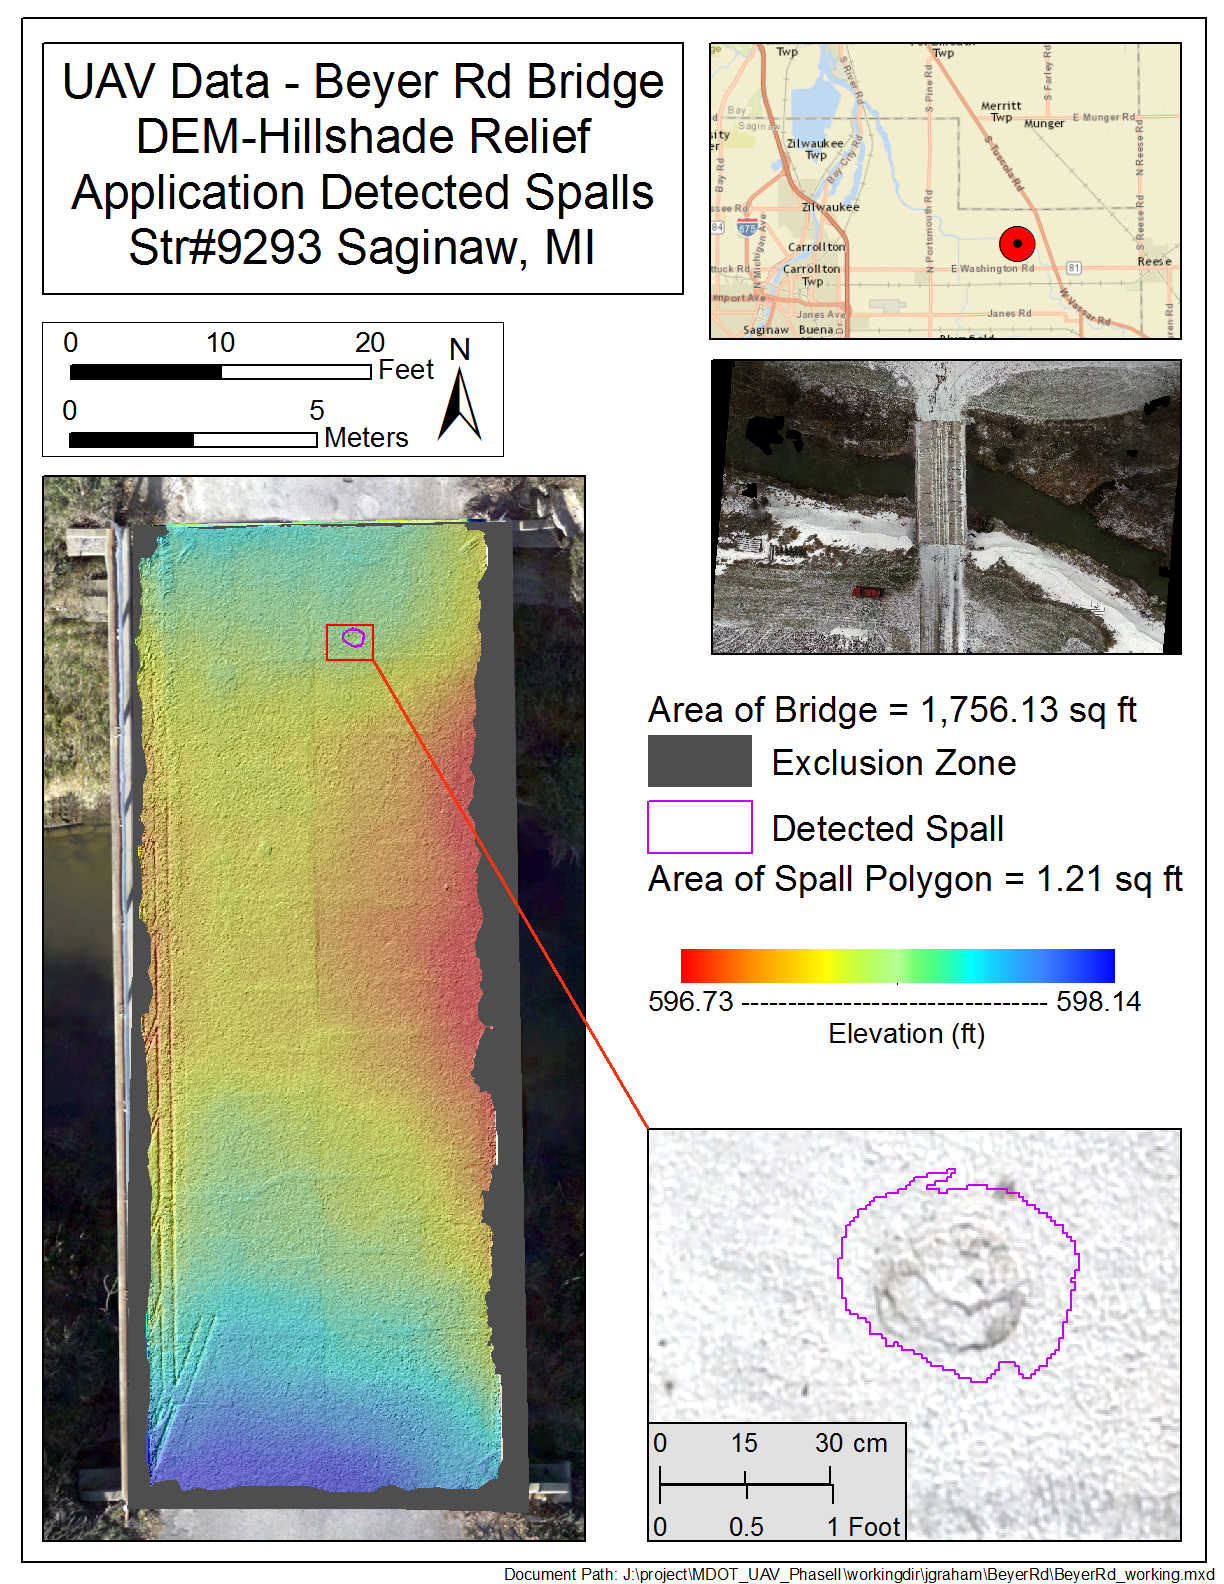
Examples of UAS-based geospatial outputs at Beyer Road Bridge. Left: The green polygons show likely delamination areas as detected by automated methods and the pink polygons are delamination marked by a MDOT bridge survey a month after the UAV thermal data collection. Right: the Beyer Road digital elevation model. Credit: Michigan Tech Research Institute
Traffic monitoring
UAS were also flown alongside a busy US highway to collect live video of traffic conditions. Initially, a small advertising blimp with an attached optical video camera was used due to its ability to monitor traffic conditions for a long time; hours as compared to 20 minutes using a standard UAS platform. However, the blimp was susceptible to wind, making stable imagery difficult to collect. Therefore, a smaller UAS, the DJI Mavic Pro, which has an onboard optical camera, was selected due to its size, ability to withstand moderate winds, and high-definition (4K) video capability.
The videos collected were processed through a semi-automated toolset, allowing users to add information about vehicles and road length properties, outputting quantitative data on vehicle speed, traffic volumes, and traffic counts. Although many transportation departments have tools that can provide these outputs, they are based on stationary cameras, whereas this developed tool is based on a mobile platform that can be deployed easily in the air. Using mobile deployments for traffic monitoring could be quite useful for emergency, sporting, entertainment events. At the completion of this analysis, 15 videos were analyzed, where over 3,000 individual vehicles were identified.
Looking ahead
Through multiple projects, MTRI has assessed and demonstrated how UAS can be used for the assessment of transportation infrastructure. These methods and tools can make assessment easier as compared to traditional manual methods. With further testing and more flexible UAS flight rules being issued, UAS-based sensing of transportation infrastructure is becoming more practical for day-to-day operations.