The new Reverse Engineering Module in VGSTUDIO MAX 3.4 makes it easy to convert CT scans into CAD models that can be used in any CAD system without the need for a CAD designer or reverse engineering specialist.
Digital analysis and physical testing are becoming increasingly integrated in the pursuit of optimized product design and development across a wide swath of industries. With the release of its VGSTUDIO MAX version 3.4 software, Volume Graphics, a CT-data analysis and visualization company, has added and augmented important functionalities that help designers and manufacturers capture and interrogate product data to improve final quality.
Reverse Engineering now available within a single software suite
When there’s no 3D CAD model of an object available, VGSTUDIO MAX 3.4’s Reverse Engineering Module provides a comprehensive suite of capabilities in one highly automated package. The Module can generate surfaces from a CT scan, or any voxel model converted from a closed mesh/point cloud scan, using an auto-surface function that is fast and accurate. This new functionality allows manually generated design models to be available digitally — without the need for a CAD designer or reverse-engineering specialist.
An important benefit is the ability to generate and archive 3D CAD models of legacy parts, as well as update those models in which the actual part or tool deviates from the master CAD model. This automates the creation of digital twins of individual parts and allows for validation of the model-to-part relationship. The recreated or newly validated CAD model can be exported as a STEP file to any CAD system. The software also enables CAM systems to mill on CAD instead of meshes.
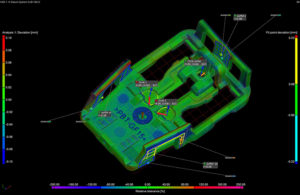
Volume Graphics software provides a visual, comprehensive, and easily understandable representation of a part’s geometrical deviations. Depending on the toleranced element, certain methods for visualizing the actual deviations can be activated, e.g., a colored and scaled deviation vector for position tolerances (above), while simultaneously showing entire patterns of position tolerances.
Compare components or samples over time to detect damage and calculate strains with DVC
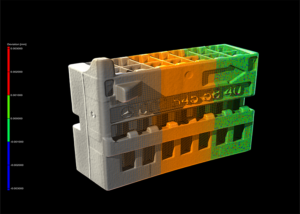
Measuring strain and quantifying and visualizing defects in material samples due to external loads are key tasks for materials scientists. The new Digital Volume Correlation (DVC) Module in VGSTUDIO MAX 3.4 helps users to quantify displacements and strains simply and intuitively between multiple states over time. It enables a precise insight into the material at hand, e.g., to detect cracks and to measure the local strain.
This is particularly useful for gaining a deeper understanding of foams, fiber composite materials or additively manufactured (AM, or 3D-printed) porous samples or components. Voxel-based, three-dimensional volumes are automatically correlated by the software, allowing for before-and-after comparisons of in-situ experiments. Results are visualized in extreme detail, making it easy to pinpoint exactly where defects or damage have occurred.
The user can quantify and visualize problems like cracks and pores, which can be missed by the naked eye, by comparing datasets at different states over time with the initial undamaged data. Results are visualized via color overlay, vector fields or strain lines. The equivalent strain or single components of the strain tensor can be shown as a color overlay and mapped directly on a volume mesh to validate the results of FEA simulations.
VGSTUDIO MAX also allows for mapping microstructure information such as fiber orientation, fiber-volume content, or matrix porosity on the same mesh that is used for the FEA. This allows the user to consider all significant microstructure information within a mechanical model and validate it by comparing FEA and DVC results.
DVC is not only helpful in the laboratory—it is also a powerful tool to detect internal damage for maintenance of composite materials, like those in a helicopter blade, by comparing a scan acquired after manufacturing with another scan of the same part after several years of use
Other enhancements to version 3.4
In addition to the new reverse engineering and volume comparison enhancements, VGSTUDIO MAX 3.4 also includes:
- New visualization options for deviations of geometric tolerances to answer questions such as: Where exactly are the highest deviations located? How are the deviations distributed on a surface? Which areas of the surface were actually evaluated?
- Subvoxel-accurate defect detection with VGEasyPore to differentiate between gas pores and shrinkage cavities.
- Stress tensor export in a .csv file of stress fields calculated using the VGSTUDIO MAX Structural Mechanics Simulation Module, e.g., for fatigue analysis.
- New, more intuitive Tool Dock that reduces mouse travel needed to navigate.
- Support of 4K displays for a crisper, sharper, and scalable graphical user interface.
Many of the enhanced capabilities released in this latest version of Volume Graphics’ software have been developed with direct input from customers. The result is a high-performance, automated package of CT-scan data analysis and visualization tools that supports design and development engineers, and manufacturers, in producing the highest-quality, most-competitive products possible.


Tell Us What You Think!