A near infrared spectrophotometer (also known as NIR spectrophotometer) is an analytical instrument used to examine pharmaceutical, chemical or medical materials in bulk, with very little sample preparation. NIR spectrophotometers measure a material’s reflection or transmission by measuring light intensity and absorbency at a specific wavelength. They offer spectral wavelength ranges around 12,500 to 4000 cm-1 or more and use high precision diode array detectors and silicon or lead-sulfide CCDs (charge-coupled devices), which a re generally more sensitive.
NIR spectroscopy is used for the compositional, functional and sensory analysis of ingredients, intermediates and final products. It is utilized in food and feed, agricultural, dairy, pharmaceutical and chemical industries, which are under constant pressure to manufacture products that meet customer specifications while increasing plant production and profitability.
NIR can be used for quantitative analysis (determination of substance concentrations), qualitative analysis (identification of raw materials, intermediate and finished products) and process control. It can provide information on moisture, protein, fat and starch content. NIR application vary in each industry and are custom designed to suit different companies and their specific products and needs.
Because of the diverse range of applications for NIR spectroscopy, NIR spectrophotometers can be reconfigured to accommodate both liquid and solid samples, including compatibility with many flow-cell types for assay analysis. Ease of use, multiple-sample capacity and portability make high-throughput, near infrared spectrometers perfect for many laboratory environments.


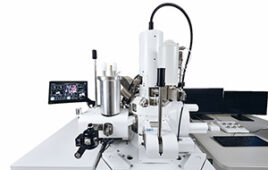
I helped augment the software that controlled a device we called the AOTF-NIR. Acoustic-Optic-Tuned-Filter.
It made use of a special crystal that changed its index of refraction based on an applied RF voltage in the 3 MHZ range. A broad spectrum lamp was used to generate the nir light. As the rf frequency was changed, the filter passed the changing nir color, along the spectrum. A scan with no sample collected the base lamp output and sensor sensitivity calibration points. After calibration a scan would show the spectral response curve, either relection or absorption. The curve was then passed off to a program that would match against known spectra and attempt to estimate concentrations of known constituents. This was at Rosemount Analytical in Orrville Ohio.