Setting inappropriate Alert and Action alarms on your Environmental Monitoring System (EMS) could be a big contributor to lost revenue, longer downtimes, and a lot of discarded product. Misinterpretation of cGMP guidelines and an inadequate approach to the use of your EMS alarming functionality may set you up for failure right from the start.
By partnering with the right EMS supplier you can have a major impact on your manufacturing process, product revenue, and regulatory approval process. Installation and proper use of an EMS depends on investing in the right supplier and on them having adequate resources to assist in maintaining the system and providing the right technical support required to enable business continuity. PICs GMP Annex 11 Computerized Systems discusses the need for a strong vendor partnership and ongoing support. Selecting the right supplier will assist in a monitoring system working for you, not against you.
When setting EMS alarm limits in sterile manufacturing, companies are restricting themselves by following a table of recommended alarm limits based on a volume of air sampled per cubic meter adopted from ISO 14644-1 — a standard with an emphasis on cleanroom certification and not on continuous particle monitoring. (Continuous particle monitoring means continuous during the production process time, not 24/7 monitoring).
Why would you implement alert and action alarms based on a cleanroom certification process which is a snap shot of a set volume which correlates to a table of maximum permitted particles per cubic meter? This quickly becomes an apples-to-oranges scenario when the medium to collect real-time particle counts is a remote particle counter with a sample rate based on a 60-second interval or 1 cubic foot per minute sample rate and the time frame is continuous for the duration of the manufacturing process. In short, it does not make sense — and it is a contributing factor to nuisance alarms being triggered during the production process. PICs GMP also tabulates alarm limits for Grade A to Grade D environments for classification which are also followed for real time monitoring.
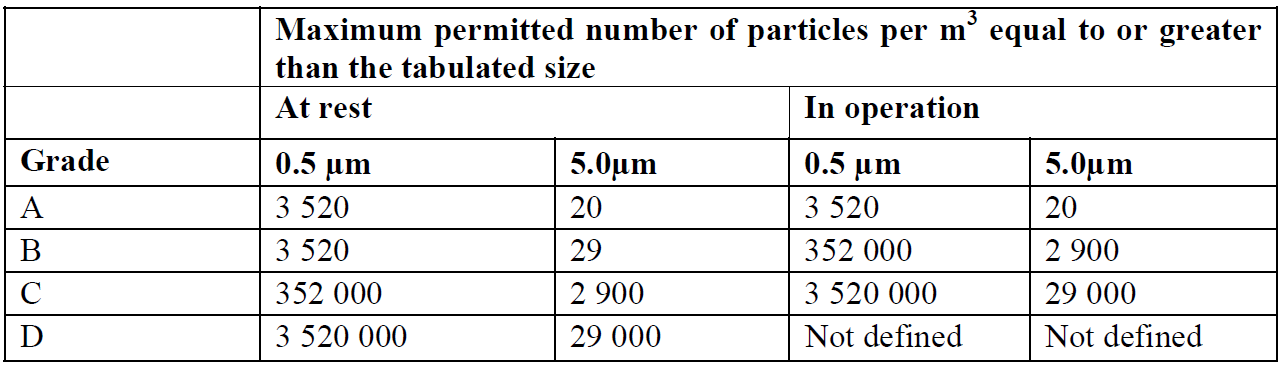
Fig. 1: PICs GMP table from Annex 1.
GMP guidelines recommend data for sizes of 0.5µm and 5.0µm is collected — the 5.0µm size range being more stringent as that size and above is normally considered the size range of bacterial types (viable particles) of particles. See the examples of the PICs GMP Annex 1 table and ISO-14644-1 tables with alarm limits based on a cubic meter sample volume. These tables are generally used to set alarm limits. You will notice the 5µm limit is 20 counts per sample volume of 1 m³ for PICs GMP — this was previously 29 counts in the ISO 14644-1 (1999) table and is now removed based on statistical limitations when sampling in low concentration areas such as Grade A or ISO Class 5 environments in ISO 14644-1 2015 revision.
Note: With the low levels of 5µm particles normally observed in these environments statistically it is not achievable to get meaningful data to make appropriate classification or real time trends.
For example, in following PICs GMP, the limit set in a Grade A environment at 0.5µm is 3,520 particles/m³ and 5.0µm is 20 particles/m³. If using a “rolling average or summation” to track this alarm limit with 5µm at 20 particles, they are pretty tight limits — and the way micro and production managers set the action alarms meant that if 1 sample period was >20 particles then it was seen an “Action Alarm” referred to as an excursion.
An SOP is typically followed, which usually means having to segregate the batch running through the filling machine and conducting a root cause investigation … and then going into the cleanroom, bringing in more people and equipment which inadvertently causes more contamination. When the root cause analysis was completed, 99 percent of the time no plausible root cause was found! However, this process managed to add more contamination to the cleanroom environment and increase downtime, thereby driving up production costs. Sounds like a futile exercise and a waste of resources, chasing a non-event simply because of inappropriate alarm settings.
The above introduction helps build up the picture for the solutions outlined below. By the way, that root cause analysis may cost upward from $10,000 to $20,000 to investigate per event with labor, other resources, and laboratory time costs — not to mention sometimes discarded batches which could be a couple hundred thousand dollars. So why did the root cause fail to identify a problem? It’s simple — alarm limits were not set up based on the actual process, the baseline of that process, and the risk to product contamination. Instead they were set up based on a table for certification purposes. It was assumed that an action alarm meant that there was a failure of the clean air system — in other words, it was not set up to look at adverse trends that may impact product quality in the actual process environment.
The problem is also that the user of the particle counter may not have correctly understood the particle counter’s limitations and functions. Particle counters count all particles regardless of viable or non-viable particles, and the sample probe needs to be positioned in a validated position to report meaningful data from the process. The main function of the particle counter is to alarm if the clean air flowing over the process is no longer acting as a clean sterile barrier based on trending data and repeated alarm events. In the case of sterile injectable or compounding applications, appropriate thought and validation needs to be undertaking to verify the best position of the sample probe, the set-points, SPC triggers for alert and action limits, as well as adequate SOPs to be executed when trending alarms are activated.
Sample probe location, risk assessment, and setting alarm limits
Probe placement
The sample probe needs to be positioned above the process zone, typically within a foot (per FDA guidelines). To correctly identify the sample position in a BSC Cabinet or filling line, the actual physical activities in those environments need to be considered as well as the process being monitored.
The sample probe should face toward the incoming clean air from the HEPA filter in that environment. A stainless steel probe is the best type of probe material to use. It should also be lined internally with Bev-A-Line tubing, which has excellent particle anti-static and transportation properties. Care must be taking to limit the length of the tubing and any bends introduced. Placing the remote particle counter as close as possible to the clean zone to be monitored is the best approach — again, stainless steel is the preferred option for remote particle counter housing. PICs GMP Annex 1 recommends keeping sample tubing as short as possible. Section 11 confirms the importance of sample tubing and sample probe placement:
Airborne particle monitoring systems may consist of independent particle counters; a network of sequentially accessed sampling points connected by a manifold to a single particle counter; or a combination of the two. The system selected must be appropriate for the particle size considered. Where remote sampling systems are used, the length of tubing and the radii of any bends in the tubing must be considered in the context of particle losses in the tubing. The selection of the monitoring system should take account of any risk presented by the materials used in manufacturing operation, for examples those involving live organisms or radio pharmaceuticals.
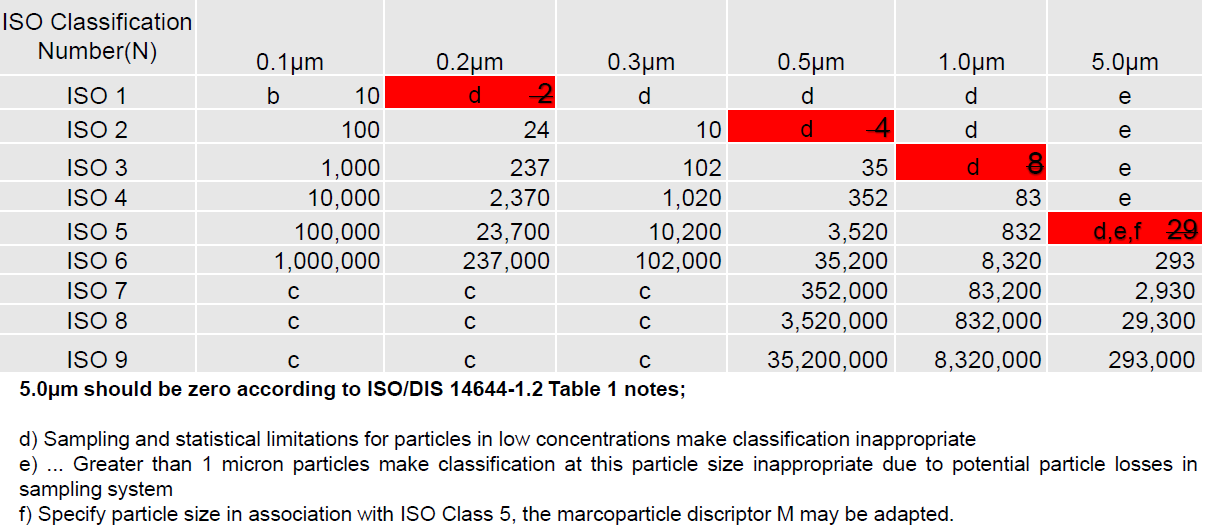
Fig 2. ISO 14644-1 table (2015).
Process simulation
A simulation of the process should pinpoint the exact location and height for the probe with the caveat that it does not interfere with the process or get in the operator’s way. Typically for a BSC or LAF cabinet, the sample probe is positioned in the middle of the cabinet since most process zones are in that area; the height of the probe needs to be strategically calculated based on the process. The same applies to critical locations on a filling line where the product is exposed, such as when open vials come out of the sterilization oven and are then transported to the filling head and right up to stoppering and capping locations. Probe height is also a critical factor and should be carefully considered in order to get meaningful data from these locations. Do not have the probe too low or too high, otherwise your system will have too many alarms — or none at all. Remember: the particle counter function is not to monitor the process, but the clean air over the process and must therefore be within a foot of the critical zone.
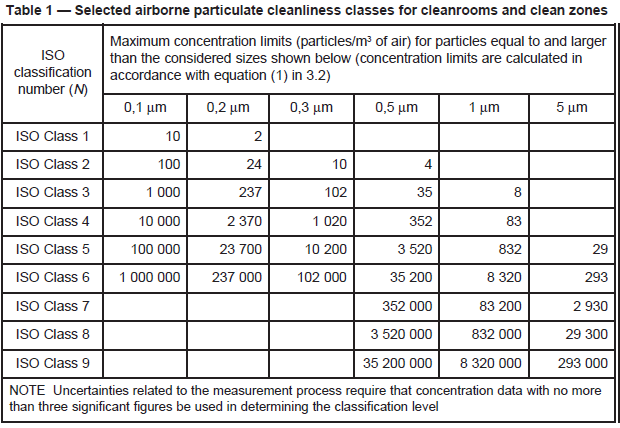
Fig. 3: ISO 14644-1 table (2009).
Alarm setting risk assessment
Setting appropriate alarm levels is a process that involves understanding of the activities within the sterile zone. The best approach to understand the risks is to validate the system. This normally occurs during a Performance Qualification (PQ) after the Monitoring System supplier has successfully completed the IQ/OQ. The end user should conduct a proper assessment of the system to understand the limitations and to then set appropriate alarm limits during the PQ. In the case of a filling line or BSC/LAF cabinet, the best approach is to set up the process and have the settle plate and air sampler also set up as part of the validation (to monitor the process).
Trial runs are conducted under normal operational conditions, and then separate fail runs are conducted. These fail runs are where the operator purposely generates particles over the process where they can be picked up by the particle counter. The resulting spike in counts are examined, as well as the recovery time which in general in a grade A environment with a 0.30 to 0.45 m/s down flow is typically within one to two minutes where zero particles are expected to be recorded by the particle counter. The settle plate and air sampler plates are incubated to back up the expectation. Meaningful and useful data is obtained during this process.
A normal correlation is that very low CFU or even zero CFU should be expected, even with high particle spikes — as long as the integrity of the critical zone remains intact and operators are gowned up correctly. The next phase is to repeat this PQ, but with the operator not correctly gowned up with wrists exposed or holes in gloves; then, repeat the test. Results typically yield a resultant correlated CFU return with the particle counter spikes.
The purpose of this test is to understand that there is a much lower probability of CFU counts when operators adhere to proper sterile gown up procedures and when there is a spike in counts. The overall probability of product contamination is nearly negligible when the compounding or sterile activity is also taken into consideration with respect to vial or connection opening and the risk that viable particles enter the vial opening and that the cleanroom is performing under the specified certified conditions. With this PQ validation process, end users can establish reasonable and justified alarm limits as they have validated their process and understand the risks and limitations of their facility, personnel, equipment process tools, and the process.
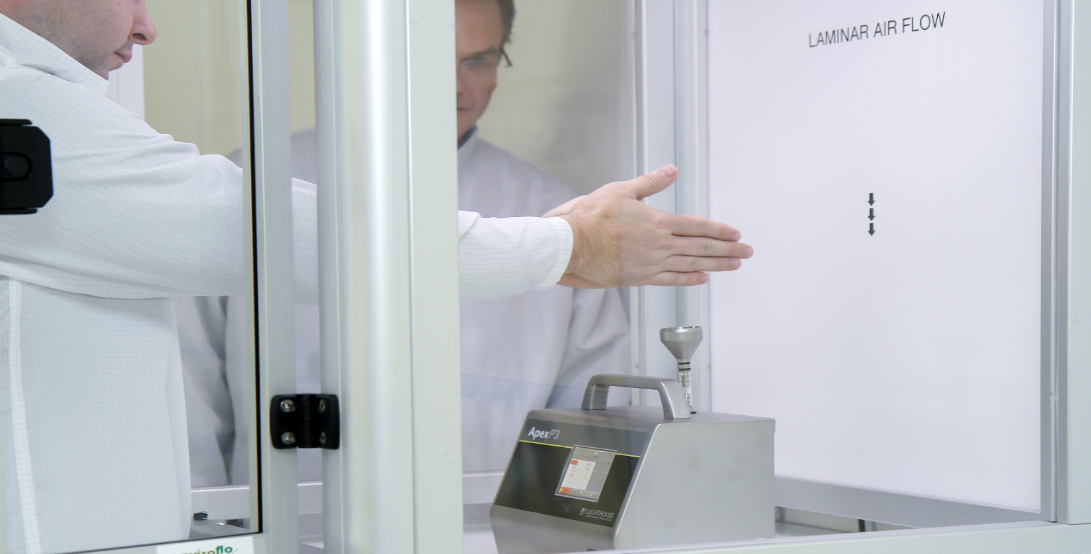
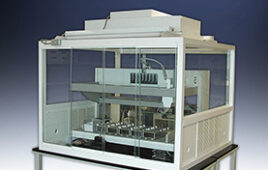
Fig. 4: Study using a portable particle counter to validate sample probe placement and height inside LAF cabinet based on process manipulations.
Setting appropriate alarm limits
The bottom line is that a good monitoring system should be able to capture transient events as well as repeatable events, interventions, and adverse trends. QA Management should be looking for trends rather than one-off singular events. The system should immediately notify operators of an action limit event so that they can figure out what is going on at the moment in time that caused the particle excursion. Locations integrating video cameras can play back to the time of particle events to verify the probable root cause, such as user intervention or broken vials; if a trend is noticed, then possible failure in the environment containment integrity and HEPA filtration can be identified.
In the end, it is all about root cause investigations and effective Corrective Action Preventative Action (CAPA) using meaningful data. If something goes wrong, you capture that event, you notify the right people immediately, and most importantly you gather enough information to help you investigate the root cause efficiently. This may be obvious, but it doesn’t hurt to restate this — a lot of end users get hung up on setting limits to correspond to the GMP Annex 1 or ISO 14644-1 tables, when in reality they should be set to detect events and adverse trends. See clause 20 from Annex 1 — it DOES NOT say to set “action and alert limits” per the classification table”
Appropriate alert and action limits should be set for the results of particulate and microbiological monitoring. If these limits are exceeded operating procedures should prescribe corrective actions.
It is the combination of the alarming features in the monitoring system software and SOPs that help to achieve compliance. Refer again to Annex 1 clause 20: the regulators are just as interested in the SOPs that come to life and are executed when the alert or action limits are exceeded. Meaning, they are more interested in what you do when an alarm is triggered and they want to see how the reaction is implemented to investigate the issue. “If these limits are exceeded operating procedures should prescribe corrective actions.”
Another issue with following GMP and ISO 14644-1 tables: if you report counts per cubic feet then you are expected to have sampled one cubic foot of air. This is no problem with 1 cfm remote particle counters, as it means they update a count sample report every 60 seconds. The problem is if data is expected in counts per cubic meter, as sampling a cubic meter of air takes nearly 36 minutes using a 1 cfm flow rate … not so good when starting a process and having to wait 36 minutes to find out the environment is outside alarm limits.
Clause 9 and Clause 12 from PICs GMP Annex 1 clearly releases users from having to take cubic meter samples when monitoring:
Clause 9: For Grade A zones, particle monitoring should be undertaken for the full duration of critical processing, including equipment assembly, except where justified by contaminants in the process that would damage the particle counter or present a hazard, e.g. live organisms and radiological hazards. In such cases monitoring during routine equipment set up operation should be undertaken prior to exposure to the risk. Monitoring during simulated operations should also be performed. The Grade A zone should be monitored at such a frequency and with suitable sample size that all interventions, transient events and any system deterioration would be captured and alarms triggered if alert limits are exceeded. It is accepted that it may not always be possible to demonstrate low levels of >5.0 µm at the point of fill when …
Clause 12: The sample sizes taken for monitoring purposes using automated systems will usually be a function of the sampling rate of the system used. It is not necessary for the sample volume to be the same as that used for formal classification of cleanrooms and clean air devices.
There are problems though when using one minute samples and reporting counts per cubic foot, especially around 5 µm particle counts if trying to adhere to the Annex 1 or ISO 14644-1 Classification tables. 5µm counts are 20 or 29, respectively, for action alarms. If you try to report the data as counts per cubic meter, you will always get an action alarm when there is a single 5µm count (1 count at 5µm in a minute sample will give you over 35 counts/m3 when normalized, which is >20 counts). Therefore, reporting particle count data for a 60 second sample interval as count/m3 is not practical or easy to alarm on. Rolling averages are used but they do not address the initial problem when a process is first started. The alarm limits really do need to be set based on a risk assessment and the process baseline results during the PQ.
The following alarm strategy has been implemented to address the above problem. Regulatory authorities will expect the end user to support any alarming strategies using sound scientific evidence; in other words, historical particle count data, qualification data and to also implement SOP’s of actions once an alarm has been triggered. The following example has been used in numerous Lighthouse Monitoring Systems across the world over several years in manufacturing facilities that go through regulatory audits.
Setting limits based on good science and PQ data and using trigger SPCs
This strategy allows for occasional events of a single 5µm particle and was developed based on the historical particle count trend observed over time and PQ observations using statistical process controls (SPCs). The Strategy shows a good understanding that we are monitoring not classifying. Allowing for the odd 5µm particle count and transient events, it will also capture a 5µm excursion and trend. The 5µm alert limit will notify end user of an adverse trend if one exists before it becomes critical. The 0.5µm alert limits will capture adverse trends based on setting appropriate alarm levels (after PQ). Note the below set-points are starting points and should be reviewed and fine-tuned during the PQ process and also reviewed regularly. If your system never alarms, then you may have set the limits too high, therefore effectively making the monitoring system redundant. Remember PICs GMP Clause 20.
“Appropriate alert and action limits should be set for the results of particulate and microbiological monitoring.”
1. Set alert and action limits on a 60 second sample interval. Expected baseline is zero.
2. Set 5µm action limit > 2 counts/ft3.
3. Set 5µm alert limit > 1 count/ft3.
This is not in agreement with Annex 1 classification table if you were to normalize the data to m3. This does, however, allow for the occasional 5µm particle count per the final sentence in clause 9 of Annex 1.
4. Set 0.5µm action limit > 100 counts/ft3.
5. Set 0.5µm alert > 50 Counts/ft3 or once historical data has been reviewed.
Around the 95th percentile or 2 x standard deviation historical mean counts.
6. Add statistical process control triggers for X out of Y events; for example, this can be 2 out of 3 or 5 out of 7 events. The point is that these SPCs must have some validation around them so you reach a point where X minutes of exceeding alarm limits has a known impact on product quality.
Something to cover in the PQ by simulation of real events during processing and the probability of product contamination based on high particle counts versus observed microbial sampling and CFUs at the same location at the same time.
Summary
Setting alarm limits in sterile manufacturing processes should not be based from a table which has been established for cleanroom certification/classification. The end user should have a well-defined PQ following a risk assessment approach which considers the location of the sample probe, length of sample tubing (to reduce particle loss issues), and monitoring system sample update rate based on the actual particle counter flow rate. All assist to establish a logical baseline from simulated or actual process conditions and have a low probability of risk. In the PQ stage, the use of settle plates and active microbial air sampling at the same location as the particle counter location can help yield significant data on the impact of high counts and long trends and the probability of product contamination.
Investing in the time and expertise to address these issues and the development of a well-rounded PQ can literally save thousands of dollars and hundreds of wasted man hours looking for root causes that do not exist in the cleanroom.
Leverage environmental monitoring systems suppliers’ experiences and their level of knowledge in particle monitoring system installations and setting appropriate alarm limits, sample probe placement with all the regulatory requirements, GMP guidelines, and standards that are expected. Selecting a monitoring system partner should not be an exercise in costs and upfront savings — the true value is in the level of experience they have and the ability of their hardware and software to offer a robust and well supported system, as well as their ongoing technical expertise and support.
References
• FDA — Sterile Drug Products produced by Aseptic Processing — Current Good Manufacturing Practice (2004)
• FDA — 21CFR11 Electronic Records; Electronic Signatures — Scope and Application (2003)
• PICs GMP Annex 1 Manufacture of Sterile Medicinal Products (2017)
• PICs GMP Annex 11 Computerized Systems (2011)
• PI 011-3 “Good Practices for Computerized Systems in GXP” Environments [Pharmaceutical Inspection Cooperation Scheme (PIC/s), 2007]
• GAMP 5 (2008)
• ISO 14644-1 Cleanrooms and associated controlled environments — Part 1 Classification of air cleanliness (1999)
• ISO 14644-1 Cleanrooms and associated controlled environments — Part 1 Classification of air cleanliness (2015)
• ISO 14644-4 Cleanrooms and associated controlled environments — Part 4 Design, construction and start-up (2001)
• PICs — Pharmaceutical Inspection Convention Pharmaceutical Inspection Cooperation Scheme — Guide to Good Manufacturing Practice for Medicinal Products PE-009-13 ( 2017)
• PICs — Pharmaceutical Inspection Convention Pharmaceutical Inspection Cooperation Scheme — PICs Guide to Good Manufacturing Practice for Medicinal Products in Healthcare Establishments PE-010-4 (2014)
• CFR 21 Parts 210 and 211
• The Good Automated Manufacturing Practice (GAMP) Guide for Validation of Automated Systems, GAMP 4 (2001)
• ISO 14971:2002 Medical Devices — Application of risk management to medical devices (2001)
Jason Kelly is Director of Systems at Lighthouse Worldwide Solutions. He has spent 20 years in management positions in environmental monitoring systems service, design, installation, validation, and ongoing support. Jason has worked on many projects for top Life Science companies, assisting in procurement, delivery, and compliance to ensure regulatory acceptance. He has worked across the world on many projects in the U.K., Ireland, Europe, and Australia, and is currently based in Oregon. [email protected]; www.golighthouse.com