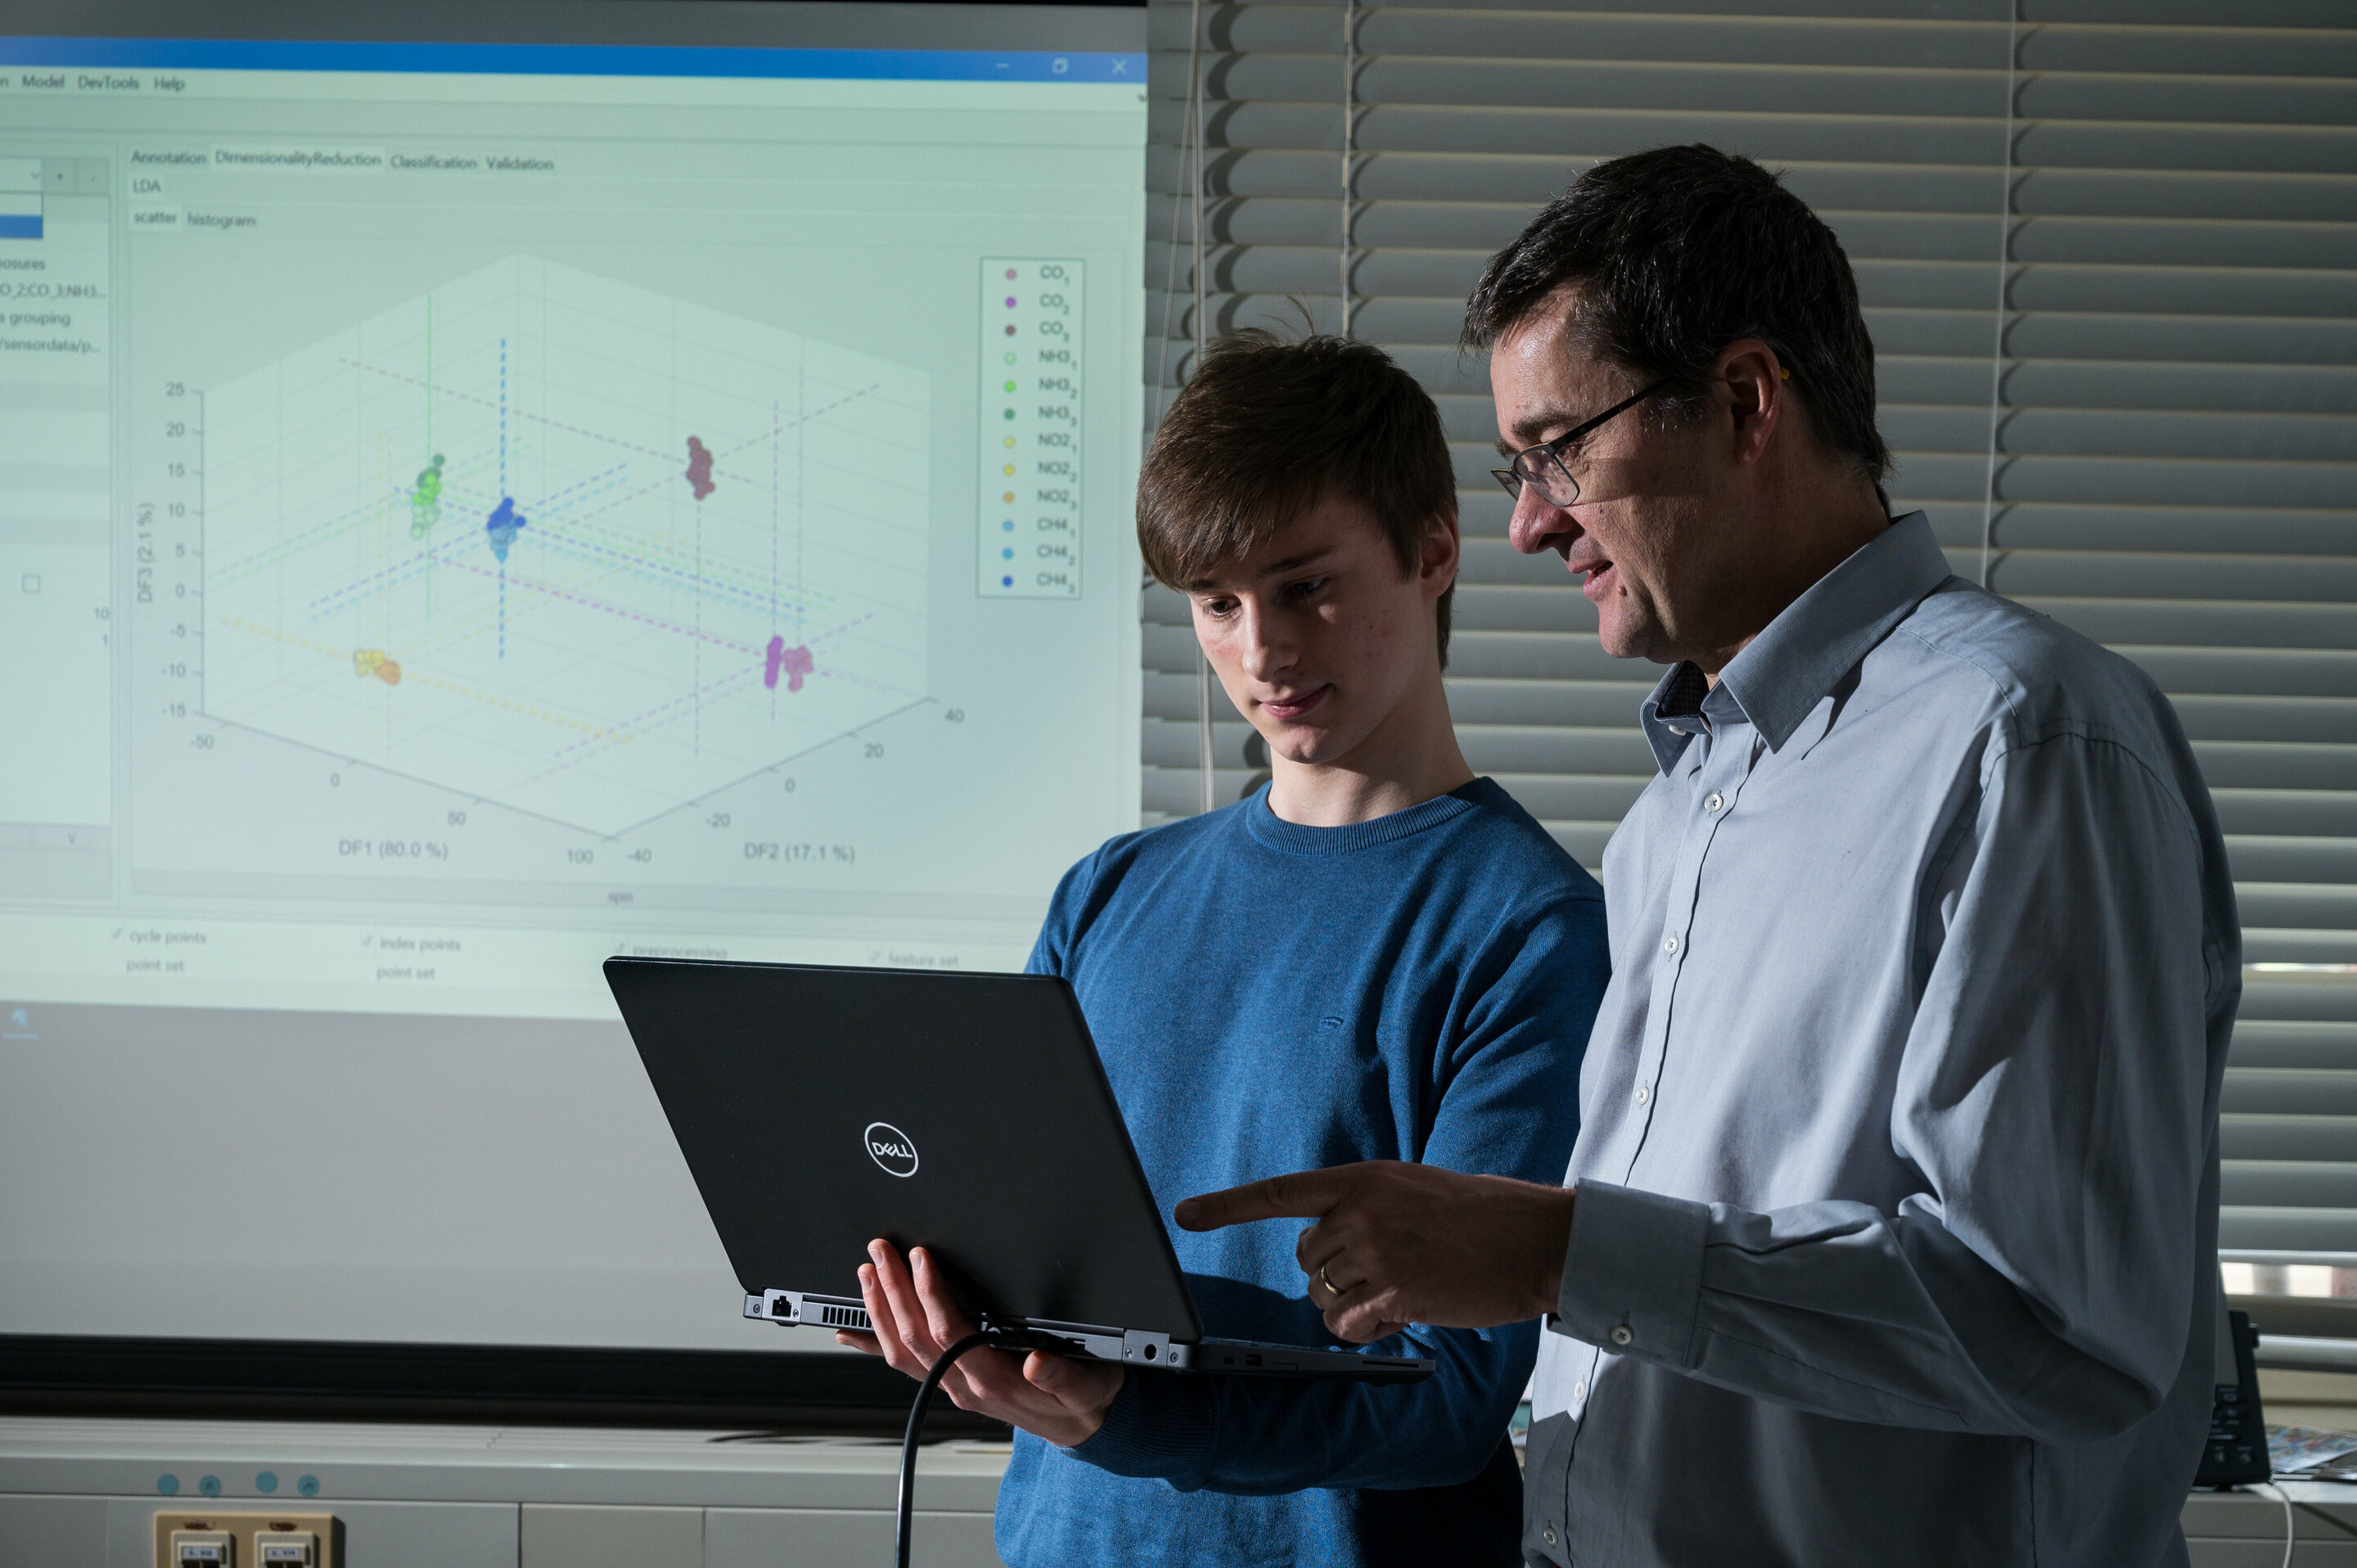
Open source software ‘Dave’: Data visualization (shown in background) helps Professor Andreas Schütze (right) and research assistant Julian Joppich (left) interactively optimize measurement systems. (Credit: Oliver Dietze)
Professor Andreas Schütze and his team of experts in measurement and sensor technology at Saarland University have released a free data processing tool called simply Dave—a MATLAB toolbox that allows rapid evaluation of signals, pattern recognition and data visualization when processing huge datasets. The free software enables very large volumes of data, such as those produced by modern sensor systems, to be processed, analyzed and visually displayed so that researchers can optimize their measurement systems interactively.
Members of the research team will be at Hannover Messe from the 1st to the 5th of April (Hall 2, Stand B46) where they will explain their open source software. The source code of the MATLAB toolbox “Dave—Data Analysis and Verification/Visualization/Validation Environment’ has been published at http://www.lmt.uni-saarland.de/dave.
When engineers conduct experiments with sensor systems, they collect huge quantities of data and have countless signals to analyze—as a result, things tend to get very complicated very quickly. Juggling all of the numbers that come flooding in from the sensors can be extremely challenging. One of the key tasks when configuring a sensor system is to optimize the parameters and variables so that the results provide meaningful information. Which settings are actually the optimal ones is something that the researchers typically have to determine heuristically—and that can take time. If the chosen relationships turn out to be unsuitable, the whole number puzzle simply collapses.
The new software is helping researchers and companies navigate the data jungle. Instead of relying on a conventional and time-consuming trial and error approach, the new software effectively asks the question “What happens when…?”
“Whenever we use our gas sensors to measure air pollutants, we are faced with the same old problem of analysing vast volumes of data and of recognizing signal patterns. If we want to continue to make our sensors more sensitive and more selective, we need to know whether very fine modifications to the sensors themselves and to the analysis actually bring about the desired improvements in sensitivity and selectivity. But there are countless ways in which sensors can be modified. We want to be able to identify the best paths as a rapidly as possible, or, equally, to quickly detect and reject the unproductive paths,” explains Schütze. “Over a period of many years and over numerous research projects, we have been developing software that helps us achieve this goal. The software makes use of machine learning methodologies and enables us to identify patterns rapidly, to evaluate data cleanly and to visualize our results.”
The software tool is available under a copyleft licence. Under copyleft rules, any adaptations of the original work, such as changes or enhancements are also bound by the same licence that covers the original work. “Anyone may use the open source software, provided that when results are published, the authors make reference to Dave,” says Schütze.
Any amount of sensor data can be processed with the Saarbrücken software tool. The software helps to rapidly locate the best paths to take. “Dave is the opposite of a black box. The software makes the calculations completely transparent. It shows the user that when they alter a particular parameter, it has a specific identifiable consequence. The visualization modules in Dave also make it easier to optimize a measurement system. The user can run through, test out and visualize different variants, and that helps the user find the most promising variants quickly and efficiently,” explains Manuel Bastuck, a research assistant in the Measurement Technology Lab and the developer of the Dave software.
“Using Dave as a tool, we were able to rapidly achieve some widely acclaimed results in the field of condition monitoring in “Industry 4.0″ applications. The results not only helped to solve the measurement problem itself, but also to configure the measuring system more simply and more cost-effectively,” says Schütze.


