Research & Development World

  • Home Page
  • Topics
    • Aerospace
    • Archeology
    • Automotive
    • Biotech
    • Chemistry
    • Environment
    • Energy
    • Life Science
    • Material Science
    • R&D Market Pulse
    • R&D Management
    • Physics
  • Technology
    • 3D Printing
    • A.I./Robotics
    • Battery Technology
    • Imaging
    • Nanotechnology
    • Semiconductors
  • Controlled Environments
    • Cleanrooms
    • Graphene
    • Lasers
    • Regulations/Standards
    • Sensors
  • Scientific Computing
    • Big Data
    • HPC/Supercomputing
    • Informatics
    • Security
    • Software
  • R&D 100 Awards
    • ENTER NOW
    • 2020 Winners
    • Winner Archive
    • R&D 100 Conference
  • Resources
    • Digital Issues
    • Podcasts
    • Subscribe
  • 2021 Funding Forecast
  • COVID-19

Satellites Map Carbon Sequestered By Forests, With Accuracy of up to 10 Meters

By VTT Technical Research Centre of Finland | April 26, 2017

Led by VTT Technical Research Centre of Finland, the EU North State project has developed a new method of using satellite images to evaluate the forest carbon balance. The carbon balance indicates how much carbon is sequestered or released by forests each year. This enables the carbon balance to be displayed on digital maps, with an accuracy of up to ten metres.

The technique involves mapping the key features of forest areas and forests -- such as the location, main tree species, height and biomass -- from images provided by the European Sentinel satellites. These digital images are fed into a model, alongside climate data. The result is carbon sequestration maps. Such maps reveal which areas are carbon sinks or carbon sources. This information can be used for activities such as planning forest management and assessing climate impacts.

The simplest maps show the amount of carbon sequestered through photosynthesis, but take no account of carbon released by the decomposition of organic matter. More refined products take account of carbon released by living plants and carbon emissions from the soil. They provide a more precise idea of the carbon balance, but require the best source data. It was possible to create more advanced carbon balance maps of Finnish territory because sufficient ground reference data was available for guiding satellite image interpretation.

"The partners in the project developed advanced methods of interpreting satellite and drone images. The University of Helsinki did the computing for the final carbon balance maps, based on VTT's satellite image interpretation. We had to invent a new approach to processing such huge quantities of data," says Research Professor Tuomas Häme.

The University of Helsinki also developed a new way of using its carbon balance model to forecast growing stock volumes. The growing stock estimates for Finland yielded almost the same result as national forest inventories.

At their most detailed, the maps had a resolution of ten metres. Coarser maps with a resolution of 500 metres were used to calculate the balance for the entire boreal coniferous forest zone from Iceland to the Urals. The same techniques could be used for satellite image interpretation and assessing the carbon balance, despite the major differences in image resolutions.

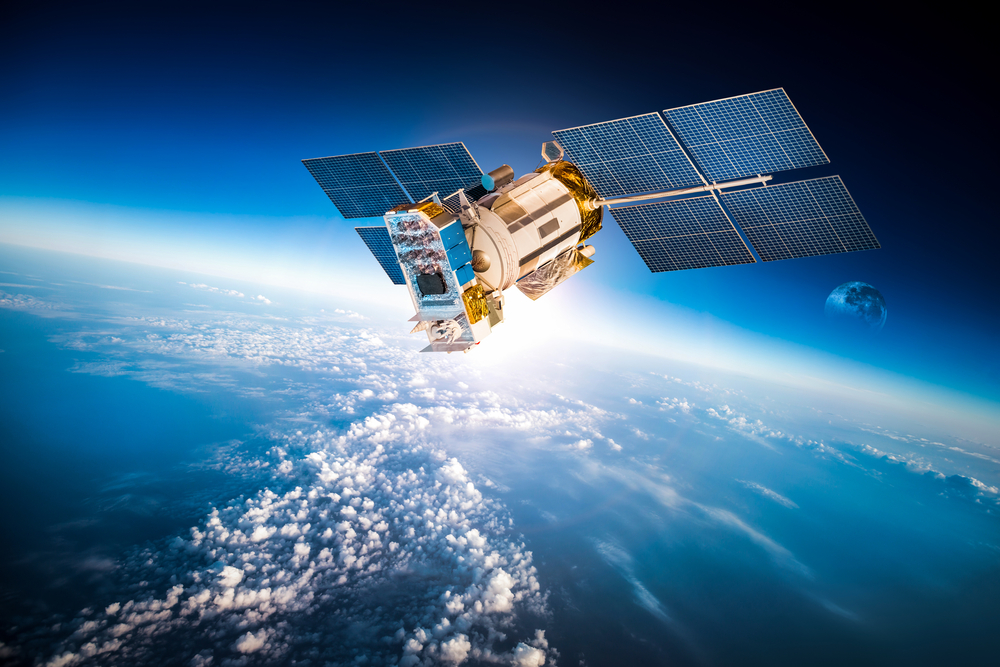
The Sentinel satellite series forms the central part of the Copernicus Programme of the EU and the European Space Agency (ESA), which will provide free satellite data from across the globe over the forthcoming decades. The current total budget for the programme is over seven billion euros.

Related Articles Read More >

R&D 100 winner of the day: CyberPow: Cyber Sensing for Power Outage Detection
Cambridge Quantum Computing launches first cloud-based Quantum Random Number Generation Service with verification in partnership with IBM
Purdue University to collaborate in NSF-funded Engineering Research Center to develop the IoT for Precision Agriculture
PicoScope 6000E Series: a smarter scope for faster debug

Need R&D World news in a minute?

We Deliver!
R&D World Enewsletters get you caught up on all the mission critical news you need in research and development. Sign up today.
Enews Signup
Tweets by @RandDWorld

R&D World Digital Issues

February 2020 issue

Browse the most current issue of R&D World and back issues in an easy to use high quality format. Clip, share and download with the leading R& magazine today.

Research & Development World
  • Subscribe to R&D World Magazine
  • Enews Sign Up
  • Contact Us
  • Drug Discovery & Development
  • Pharmaceutical Processing
  • 2021 Global Funding Forecast

Copyright © 2021 WTWH Media LLC. All Rights Reserved. The material on this site may not be reproduced, distributed, transmitted, cached or otherwise used, except with the prior written permission of WTWH Media
Privacy Policy | Advertising | About Us

Search R&D World

  • Home Page
  • Topics
    • Aerospace
    • Archeology
    • Automotive
    • Biotech
    • Chemistry
    • Environment
    • Energy
    • Life Science
    • Material Science
    • R&D Market Pulse
    • R&D Management
    • Physics
  • Technology
    • 3D Printing
    • A.I./Robotics
    • Battery Technology
    • Imaging
    • Nanotechnology
    • Semiconductors
  • Controlled Environments
    • Cleanrooms
    • Graphene
    • Lasers
    • Regulations/Standards
    • Sensors
  • Scientific Computing
    • Big Data
    • HPC/Supercomputing
    • Informatics
    • Security
    • Software
  • R&D 100 Awards
    • ENTER NOW
    • 2020 Winners
    • Winner Archive
    • R&D 100 Conference
  • Resources
    • Digital Issues
    • Podcasts
    • Subscribe
  • 2021 Funding Forecast
  • COVID-19