 For 2020, U.S. academic researchers will have at their disposal about $90.1 billion-worth of research funds or about 14.8% of the total U.S. R&D expendature. Individual U.S. academic institutions will invest about $23.2 billion (or about 3.8% of the total U.S. R&D investment) of their own resources to support this R&D. Of the R&D that academia performs, about 64% is focused on basic research, 26% on applied research, and the remaining 10% on experimental development work.
U.S. academia performs more R&D in total than all other countries except for China, Japan, Germany, India and South Korea. Academic R&D performance varies considerably from country to country. While U.S. academia performs about 15% of the total U.S. R&D, U.K. academia performs about 26% of that country’s R&D, Sweden’s academia performs about 13%, Russia’s only about 5%, Norway’s about 31% of their total, Japan’s about 12%, France’s about 20%, and Canada’s academic institutions perform about 35% of the nation’s total R&D.
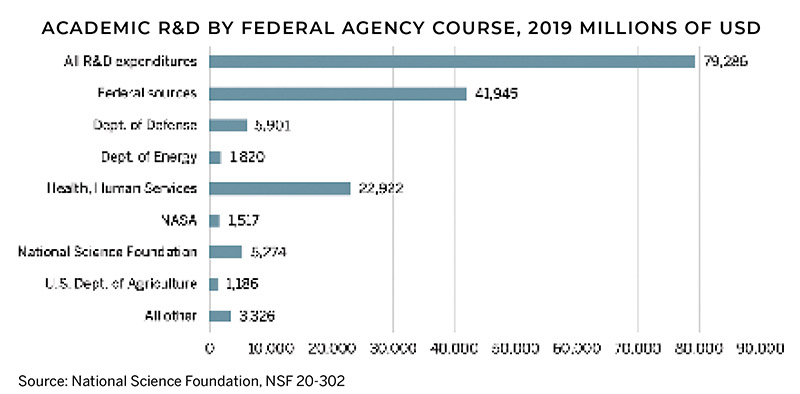
Federal funding accounts for about 52% of all U.S. academic R&D in 2020, with industrial funding providing 11% of the funds and other state sources providing 5%. The sources of funds for the countries noted above vary similarly as the performance values vary. Federal funds for U.S. academic R&D have risen for four consecutive years according to data from the NSF’s Higher Education R&D (HERD) survey. With the strong rise in federal R&D funding in the FY2020 budget, that trend is likely to continue in 2020.
The National Institutes of Health (NIH) component of the Dept. of Health and Human Services (HHS) has the largest federal government R&D budget, accounting for nearly 55% of all government R&D funding ($41.9 billion in FY2018). R&D expenditures funded by the universities’ own sources were about $20.4 billion in FY2018. This amount was 26% of the total HERD and about 55% of the total nonfederal academic R&D funding.
 Foreign sources of academic R&D funding are also captured in the HERD survey managed by the National Science Foundation (NSF). According to this survey, about $1.3 billion in foreign funds supported HERD in FY2018. These foreign sources consisted of $546 million from foreign industry, $273 million from foreign nonprofit organizations, $253 million from foreign governments, $118 million from foreign academia and $68 million from all other foreign sources.
Higher Education R&D Expenditures, by type of cost (Source: NSF, FY2018)
• Direct Costs 76.9%
• Salaries, wages, benefits 43.8%
• Software purchases 0.2%
• Capitalized equipment 2.7%
• Subrecipient costs 8.0%
• Other direct costs (travel, supplies, consultants) 22.2%
• Indirect costs 23.1%
• Recovered 16.1%
• Unrecovered 7.0%
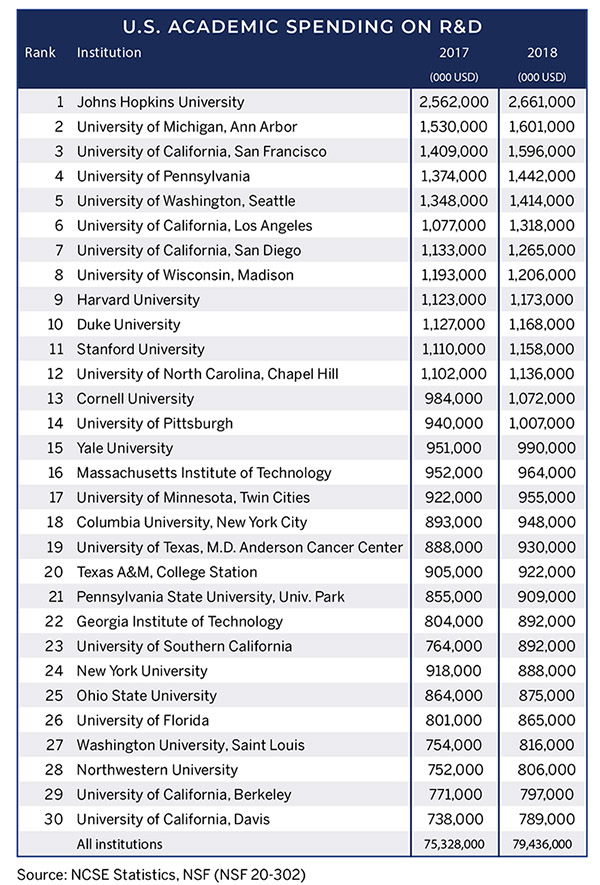
Top R&D universities
The top R&D spending universities shown on the nearby table accounted for about 42% of the total spent within the higher education sector in 2018 (in this situation, 2018 represents the school years starting on July 1, 2017 through June 30, 2018. The data was collected for the NSF from a census of 915 universities that grant bachelors’ degrees or higher and spent at least $150,000 in school year 2018. The amounts reported in this section include all R&D funds spent on activities specifically organized to produce research outcomes and sponsored by an outside organization or by using institution funds. These do not include FFRDC (federally funded R&D centers).
 While the federal government continues as the largest provider of R&D funds to academia, its share of R&D funds has seen a slow decline over the past decade. In contrast, academia’s share of R&D spending has grown in recent years to reach historically high share levels.
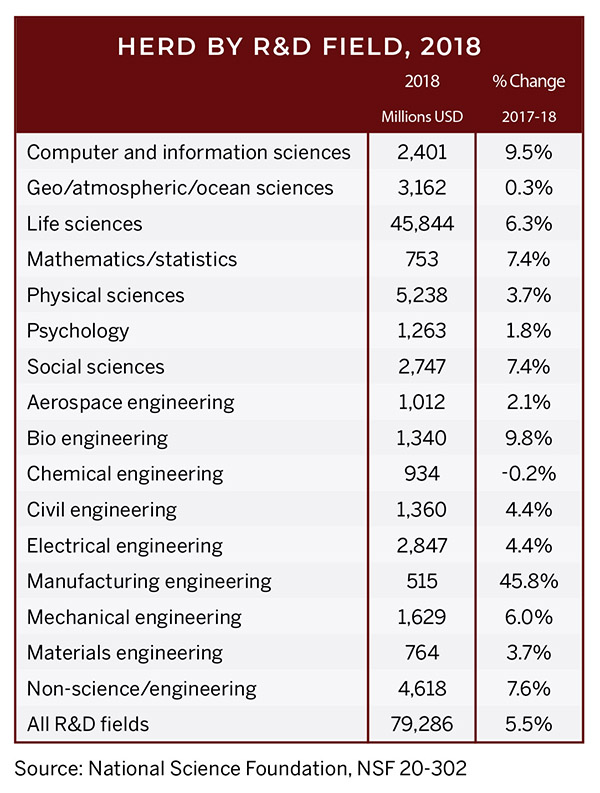
Over the past 30 years, the distribution of academic R&D spending has shifted in favor of life sciences (i.e., NIH) and away from the physical sciences (i.e., DOE, NIST). Engineering R&D, however, has grown faster over the past decade than has R&D in the life sciences but still only accounts for about a third as much as federally supported life science R&D ($12.3 billion vs $45.8 billion). Non-science and engineering fields of R&D, such as education, business and humanities, account for less than 6% of total R&D spending sponsored by the federal government.
Public universities rely more heavily than private universities on state and local government funding — 8% versus 1%. Public universities also rely slightly more heavily on their own funds for their R&D work — 27% versus 21%. Private universities also receive a larger share of their R&D funding from the federal government (60% versus 51%) and also slightly more on business support (7% versus 5%) and nonprofit funding (8% versus 6%).
U.S. academic infrastructure has taken a small hit over the past several years. For one thing, the total research space in academia has only risen slightly (1.4% from 2013 to 2015) the slowest growth rate in 30 years. About 16% of the space needs renovation, and 4% needs to be replaced. And equipment spending is only about 3.1% of the total academic R&D budget, again the lowest rate in 30 years.
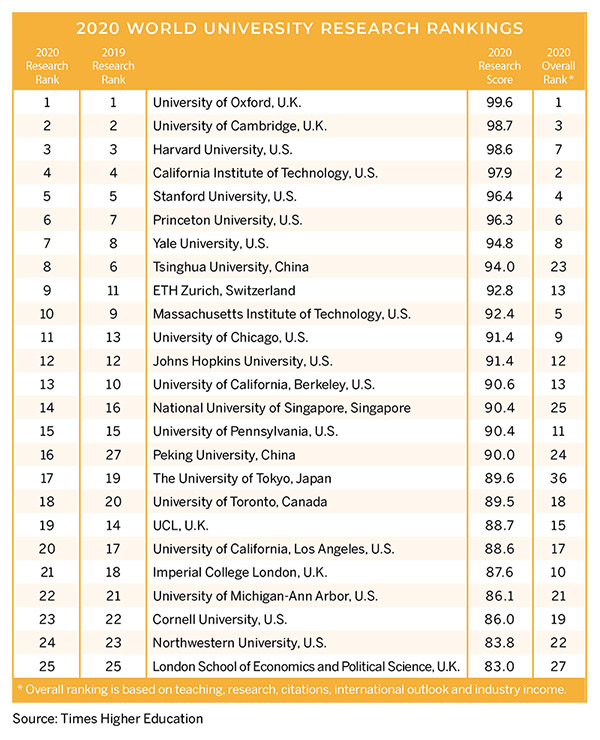
Global academic R&D
The Times Higher Education (THE) university rankings in 2020 evaluated nearly 1,400 global universities from 92 countries. The rankings are based on surveys relating to the individual universities’ teaching (30%), research (30%), citations (30%), international outlook (7.5%) and industry income (2.5%). The numbers for each university are standardized and calculated with a cumulative probability function utilizing a version of z-scoring. THE rankings have been created for 50 years and are utilized by university leaders, industry and governments to evaluate their own performance. The results can be evaluated according to specific categories as noted in the nearby table listing the top 25 global universities ranked by research capabilities.
 THE also provides data on institutional income per academic with notable changes seen in individual countries. U.K. incomes have risen by 6.5% between 2016 and 2020, while German academia has risen 38%, China’s by 57.1%, and U.S. academic incomes rising by 12.5%. The income gains made by each country’s institutions are in part responsible for the gains or losses in THE rankings.
As shown in the table, 14 of the top 25 research universities reside in the U.S., five are in the U.K., two are in China and one each resides in Japan, Switzerland, Singapore and Canada.
Of the top 200 THE 2020 universities, 60 reside in the U.S., 28 in the U.K., 23 in Germany, 11 each in Australia and the Netherlands, seven each in Canada, China and Switzerland, six in South Korea and five each in France, Hong Kong and Sweden. For 2020, the U.K. dropped from 34 in THE 2019 rankings, Germany and Australia each gained three in the top 200 and China gained two.
China continues to enhance and support its higher education system, and its position in the THE rankings continues to rise each year. The number of U.S. universities ranked has slowly declined over the past five years due primarily to the gains made by universities in other countries, rather than that capabilities of U.S. institutions are declining. The international higher education market has become increasingly competitive over the past several years. The trend pushes the non-U.S. universities harder to their programs are genuinely world class.
This article is part of R&D World’s annual Global Funding Forecast (Executive Edition). This report has be published annually for more than six decades. To purchase the full, comprehensive report, which is 58 pages in length, please visit the 2020 Global Funding Forecast homepage.


Hi there
I am looking for some sources on your info in the following paragraph:
“U.S. academia performs more R&D in total than all other countries except for China, Japan, Germany, India and South Korea. Academic R&D performance varies considerably from country to country. While U.S. academia performs about 15% of the total U.S. R&D, U.K. academia performs about 26% of that country’s R&D, Sweden’s academia performs about 13%, Russia’s only about 5%, Norway’s about 31% of their total, Japan’s about 12%, France’s about 20%, and Canada’s academic institutions perform about 35% of the nation’s total R&D.”
I am researching Global R&D spend at Universities in 2018 and
% of University R&D that is turned into commercial ventures.
It seems that the paragraph above answers at least one of my questions, and wanted some more detail.
Many thanks!
The sources for the data shown are listed in each chart.
The other data is a direct result of all the data in the GFF.
Some of the data for different countries is based upon research and
surveys from previous years’ GFF. Other data is based directly on National
Science Foundation reports. the NSF has a treasure trove of R&D data on
academia.
I do not have current data on the amount of academic R&D that is directly
transformed into commercial products. I do have a little dated data (5+
yrs) which is fairly reliable based upon data from a PhD candidate’s
thesis. R&D 100 products are also a good indicator of the number of
products created from academic (and other) R&D investments.
Hope this helps
Thanks
Tim Studt