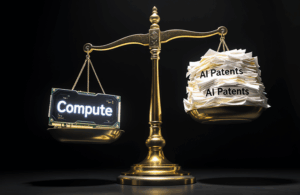
 Shipping frontier models and securing compute or partnerships is often a stronger moat than piling up AI patents.
A recent case in point: Nvidia said it would invest up to $100B to build 10 GW of AI infrastructure for OpenAI, which would make it the largest single AI-data center build to date. The first 1 GW targeted for the second half of 2026.
By contrast, Microsoft’s backing of OpenAI has been described as “multiyear, multibillion” (widely reported at $13B), paired with Azure as OpenAI’s primary cloud through 2024. Rather than a precise dollar figure, Microsoft’s on-record statements emphasize the exclusive cloud aspect and supercomputing buildouts
In patents, the leaderboard looks different. In our 500-company panel (Jan 2023–Oct 2024; distinct publication counts with subsidiary roll-ups), Samsung leads with 9,982 AI publications, ahead of Alphabet at 8,573. (These are from our dataset sourced from Google Patents; we footnote the roll-up method below.)
Alphabet, which comes in second in the patent ranking, has poured billions into its TPU-based infrastructure and Gemini effort; a TPU (Tensor Processing Unit) is Google’s custom AI accelerator ASIC used in pods (e.g., v5p pod = 8,960 chips), though Google does not disclose total fleet counts.
Meta is also pursuing an infrastructure-first path: reports indicate Meta agreed to take a roughly 49% stake in Scale AI for about $14–15B, while Louisiana approved incentives and power to support Meta’s planned $10B Richland Parish data center build. Together, those moves prioritize model deployment capacity over incremental IP.
OpenAI’s public patent footprint remains small (dozens globally), yet it leads the frontier model market through access to guaranteed, large-scale compute. The prospective $100B Nvidia–OpenAI buildout underscores the point: in the LLM era, reserved infrastructure and strategic partnerships often matter more than amassing large patent portfolios.
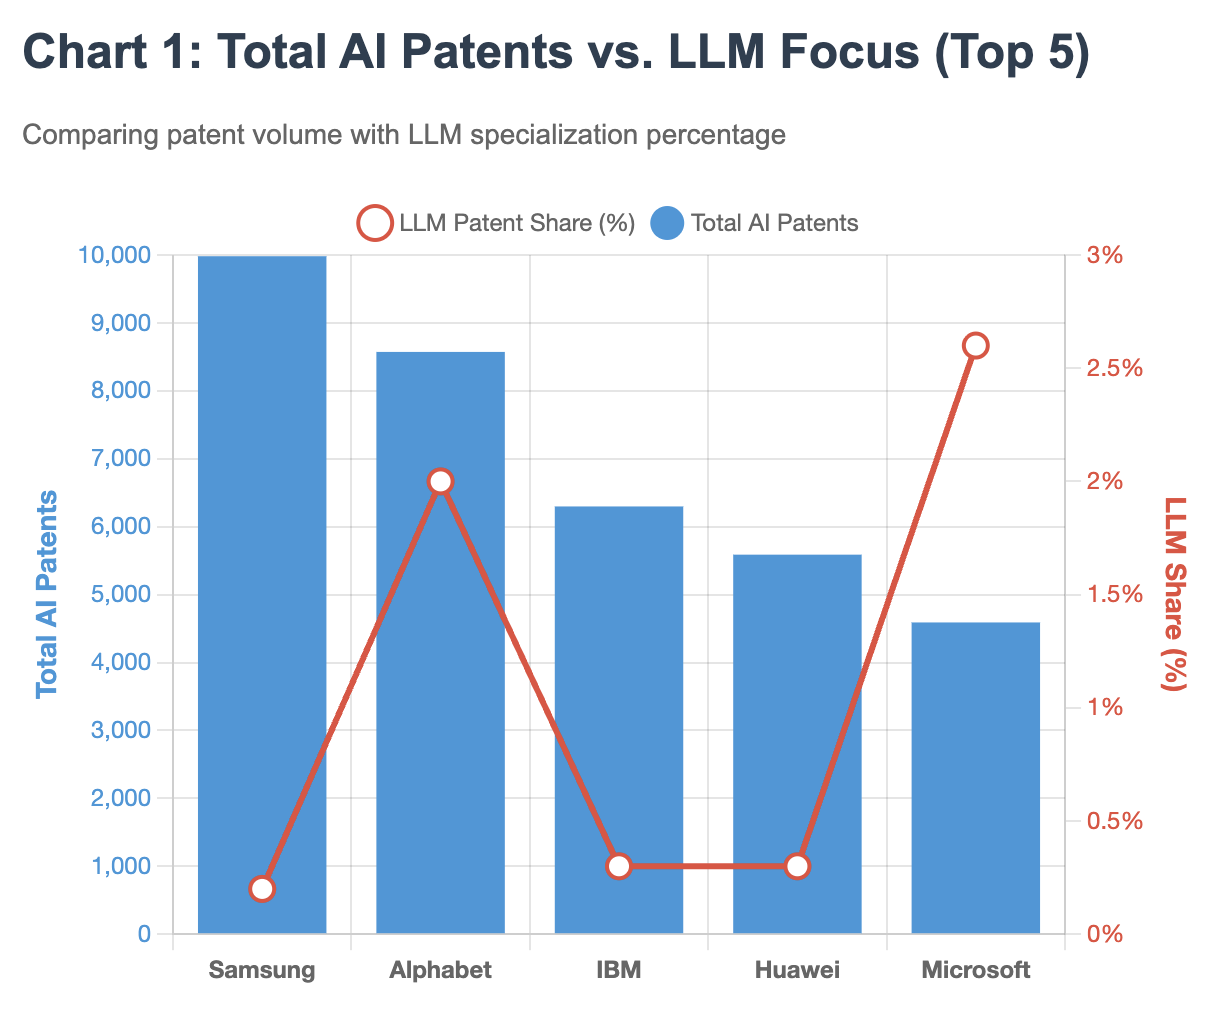
Samsung’s towering lead in total AI patents—nearly 10,000 publications, corresponds to just 0.2% LLM focus, while Microsoft, with less than half Samsung’s patent volume, shows 13 times higher LLM concentration at 2.6%. This inverse relationship between patent quantity and frontier model relevance suggests companies are optimizing for different competitive advantages. See Chart 1:
| # | Company (Parent) | Total | 2023 | 2024 (Jan–Oct) |
|---|---|---|---|---|
| 1 | Samsung | 9,982 | 5,186 | 4,796 |
| 2 | Alphabet | 8,573 | 4,462 | 4,111 |
| 3 | IBM | 6,298 | 4,306 | 1,992 |
| 4 | Huawei | 5,588 | 3,010 | 2,578 |
| 5 | Microsoft | 4,590 | 2,565 | 2,025 |
| 6 | Sony | 3,496 | 1,935 | 1,561 |
| 7 | Baidu | 3,402 | 2,363 | 1,039 |
| 8 | Qualcomm | 3,121 | 1,595 | 1,526 |
| 9 | NEC | 3,115 | 1,685 | 1,430 |
| 10 | ByteDance | 2,149 | 1,022 | 1,127 |
While Baidu has the highest LLM patent share (4.6%) in the top ten, about 156 of 3,402 AI publications, Microsoft (2.6%) and Alphabet (2.0%) follow at roughly 120 and 170 respectively. Samsung, despite leading with nearly 10,000 AI publications, had 20 explicitly LLM-related filings (0.2%) in the sample, while Sony, Qualcomm and NEC showed near-zero LLM activity in this window.
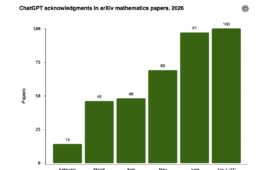
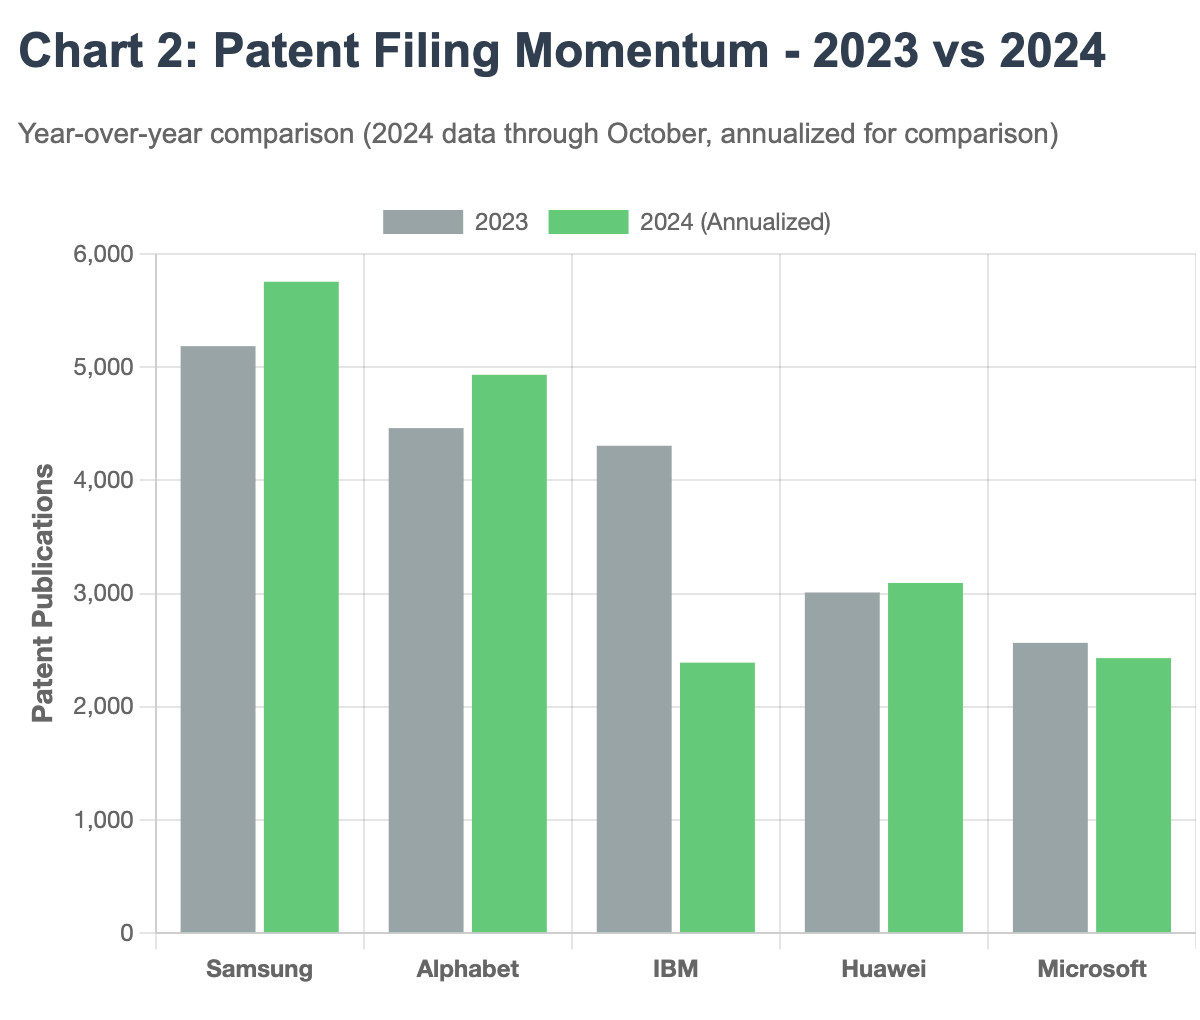
Filing momentum tells another story. While Samsung and Alphabet maintain steady patent production year-over-year, IBM’s 2024 filings have plummeted by 54% when annualized, from 4,306 in 2023 to a projected 2,390 for full-year 2024. See Chart 2:
| Company | Baseline Entity | Uplift (×) | Unique Families | LLM Share |
|---|---|---|---|---|
| Samsung | SAMSUNG ELECTRONICS CO LTD | 1.12 | 5,380 | 0.2% |
| Alphabet | GOOGLE LLC | 1.30 | 4,079 | 2.0% |
| IBM | IBM | 1.00 | 3,904 | 0.3% |
| Huawei | HUAWEI TECH CO LTD | 1.00 | 2,713 | 0.3% |
| Microsoft | MICROSOFT TECHNOLOGY LICENSING LLC | 1.00 | 2,412 | 2.6% |
| Sony | SONY GROUP CORP | 1.98 | 2,146 | 0.0% |
| Baidu | BEIJING BAIDU NETCOM SCI & TECH CO LTD | 1.29 | 2,846 | 4.6% |
| Qualcomm | QUALCOMM INC | 1.00 | 1,187 | 0.0% |
| NEC | NEC CORP | 1.00 | 1,929 | 0.0% |
| ByteDance | BEIJING ZITIAO NETWORK TECHNOLOGY CO LTD | 1.38 | 1,325 | 0.1% |
“Uplift” quantifies the effect of rolling up subsidiaries present in the dataset; “LLM Share” = LLM-related share of each group’s AI publications.
“LLM Share” is the share of each parent’s AI publications tagged as LLM-related in our text heuristic (e.g., “large language model,” “LLM,” “GPT,” “generative pre-train*”). It’s directional, not definitive: some LLM-adjacent claims won’t use those terms, and a small number of false matches can occur. We include it to indicate relative emphasis, not as a strict taxonomy.
Methodology: Figures above reflect distinct patent publications from Jan 2023–Oct 2024, aggregated at the parent level by rolling up subsidiaries that appear in this dataset (e.g., Google/Google DeepMind/Waymo were rolled up). Year splits (2023; 2024 Jan–Oct) sum to the total for each assignee. “LLM share” uses a text-based flag on titles/abstracts (e.g., “large language model,” “LLM,” “GPT,” “generative pre-train*”) applied after the AI inclusion gate (CPC families such as G06N/G06V/G10L/G06F40).
Limitations (how to read this): Counts are publication-level, not grants; 2024, though in the past, is partial-year given patent reporting lags (comparisons use a simple annualization note in the table). Parent roll-ups include only subsidiaries present in the file, which can slightly understate some parents.