Research & Development World

  • R&D World Home
  • Topics
    • Aerospace
    • Automotive
    • Biotech
    • Careers
    • Chemistry
    • Environment
    • Energy
    • Life Science
    • Material Science
    • R&D Management
    • Physics
  • Technology
    • 3D Printing
    • A.I./Robotics
    • Software
    • Battery Technology
    • Controlled Environments
      • Cleanrooms
      • Graphene
      • Lasers
      • Regulations/Standards
      • Sensors
    • Imaging
    • Nanotechnology
    • Scientific Computing
      • Big Data
      • HPC/Supercomputing
      • Informatics
      • Security
    • Semiconductors
  • R&D Market Pulse
  • R&D 100
    • 2026 R&D 100 Award Winners
    • 2026 Professional Award Winners
    • 2026 Special Recognition Winners
    • R&D 100 Awards Event
    • R&D 100 Submissions
    • Winner Archive
  • Resources
    • Research Reports
    • Digital Issues
    • Educational Assets
    • Subscribe
    • Video
    • Webinars
    • PharmSci360
    • Content submission guidelines for R&D World
  • Global Funding Forecast
  • Top Labs
  • Advertise
  • SUBSCRIBE

New Maps Show How Our Consumption Affects Wildlife

By Kenny Walter | January 5, 2017

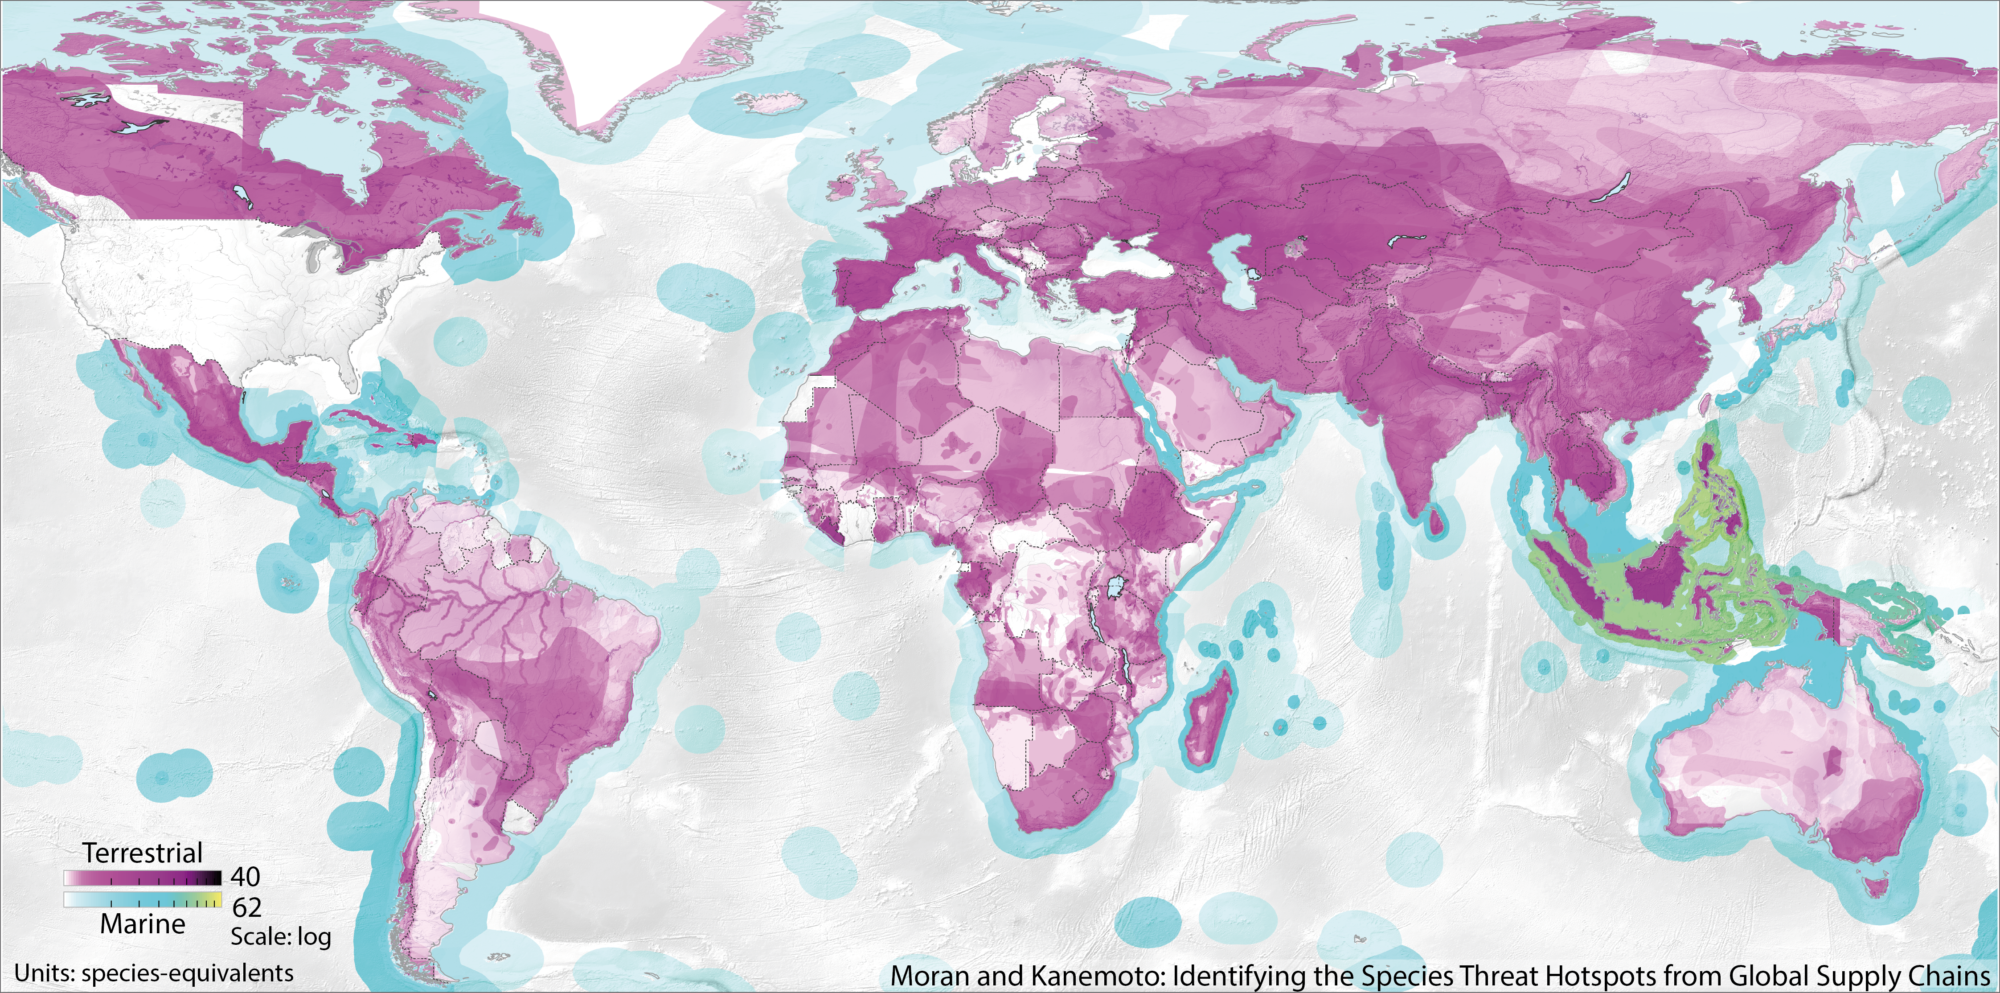
This map shows the species threat hotspots caused by US consumption. The darker the color, the greater the threat caused by the consumption. The magenta color represents terrestrial species, while the blue represents marine species. (Map courtesy of Daniel Moran & Keiichiro Kanemoto)

Researchers have developed a new technique that identifies threats to various species caused by the global supply chains that fuel our consumption.

Daniel Moran, Ph.D., from the Norwegian University of Science and Technology and his colleague Keiichiro Kanemoto, Ph.D., from Shinshu University in Japan, have created a series of world maps that show the species threat hotspots across the globe for individual countries.

Moran and Kanemoto were able to calculate the percentage of threat to 6,803 vulnerable, endangered or critically endangered marine and terrestrial animals as defined by the International Union for Conservation of Nature and BirdLife International.

The researchers considered the threat to a species in one country due to consumption of goods in another when they calculated the percentage of threat.

For example, they found that consumption in the U.S. caused species threat hotspots to several regions including southeast Asia and Madagascar, Central Asia, Central America, the coasts of Mexico and southern Canada, as well as threats in southern Spain and Portugal.

According to Moran, making the connections between consumption and environmental impacts can help government entities, companies and individuals find ways to counteract them.

“Connecting observations of environmental problems to economic activity, that is the innovation here,” Moran said in a statement. “Once you connect the environmental impact to a supply chain, then many people along the supply chain, not only producers, can participate in cleaning up that supply chain.”

Moran said if the European Union (EU) wanted to look at its role in causing biodiversity losses and deforestation in Indonesia, it could look at the maps and see what kind of impacts EU consumers are having on the country and where those impacts are located.

“The EU could decide to adjust their research programs or environmental priorities to focus on certain hotspots in Southeast Asia,” Moran said. “Companies could also use these maps to find out where their environmental impact hotspots are, and make changes.”     

The research was published in Nature Ecology & Evolution.
Related Articles Read More >

Research vessel Nautilus is mapping the bottom of the Mariana Trench with new multibeam sonar 
Inside the Lab: NETL’s Oil and Gas Center of Excellence focuses on technologies to enhance production   
How LLNL won a $2M grant and found a commercialization partner for its methanol reactor design 
New process could reduce energy needed for crude-oil distillation by 31%
rd newsletter
EXPAND YOUR KNOWLEDGE AND STAY CONNECTED
Get the latest info on technologies, trends, and strategies in Research & Development.

R&D World Digital Issues

Fall 2025 issue

Browse the most current issue of R&D World and back issues in an easy to use high quality format. Clip, share and download with the leading R&D magazine today.

R&D 100 Awards
Research & Development World
  • Subscribe to R&D World Magazine
  • Sign up for R&D World’s newsletter
  • Contact Us
  • About Us
  • Drug Discovery & Development
  • Pharmaceutical Processing
  • Global Funding Forecast

Copyright © 2026 Arrowfly LLC. All Rights Reserved. The material on this site may not be reproduced, distributed, transmitted, cached or otherwise used, except with the prior written permission of Arrowfly
Privacy Policy | Advertising | About Us

Search R&D World

  • R&D World Home
  • Topics
    • Aerospace
    • Automotive
    • Biotech
    • Careers
    • Chemistry
    • Environment
    • Energy
    • Life Science
    • Material Science
    • R&D Management
    • Physics
  • Technology
    • 3D Printing
    • A.I./Robotics
    • Software
    • Battery Technology
    • Controlled Environments
      • Cleanrooms
      • Graphene
      • Lasers
      • Regulations/Standards
      • Sensors
    • Imaging
    • Nanotechnology
    • Scientific Computing
      • Big Data
      • HPC/Supercomputing
      • Informatics
      • Security
    • Semiconductors
  • R&D Market Pulse
  • R&D 100
    • 2026 R&D 100 Award Winners
    • 2026 Professional Award Winners
    • 2026 Special Recognition Winners
    • R&D 100 Awards Event
    • R&D 100 Submissions
    • Winner Archive
  • Resources
    • Research Reports
    • Digital Issues
    • Educational Assets
    • Subscribe
    • Video
    • Webinars
    • PharmSci360
    • Content submission guidelines for R&D World
  • Global Funding Forecast
  • Top Labs
  • Advertise
  • SUBSCRIBE