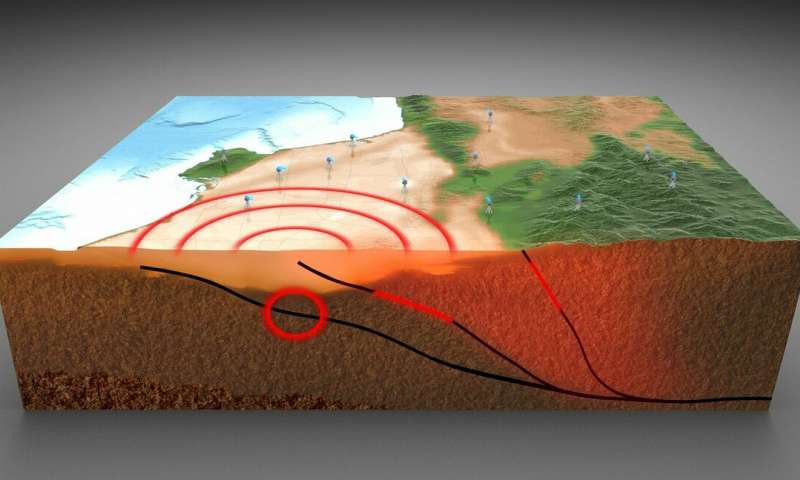
Credit: Juan Vargas, Jean-Philippe Avouac, Chris Rollins / Caltech
Geophysicists at Caltech have created a new method for determining earthquake hazards by measuring how fast energy is building up on faults in a specific region, and then comparing that to how much is being released through fault creep and earthquakes.
They applied the new method to the faults underneath central Los Angeles, and found that on the long-term average, the strongest earthquake that is likely to occur along those faults is between magnitude 6.8 and 7.1, and that a magnitude 6.8—about 50 percent stronger than the 1994 Northridge earthquake—could occur roughly every 300 years on average.
That is not to say that a larger earthquake beneath central L.A. is impossible, the researchers say; rather, they find that the crust beneath Los Angeles does not seem to be being squeezed from south to north fast enough to make such an earthquake quite as likely.
The method also allows for an assessment of the likelihood of smaller earthquakes. If one excludes aftershocks, the probability that a magnitude 6.0 or greater earthquake will occur in central LA over any given 10-year period is about 9 percent, while the chance of a magnitude 6.5 or greater earthquake is about 2 percent.
A paper describing these findings was published by Geophysical Research Letters on February 27.
These levels of seismic hazard are somewhat lower but do not differ significantly from what has already been predicted by the Working Group on California Earthquake Probabilities. But that is actually the point, the Caltech scientists say.
Current state-of-the-art methods for assessing the seismic hazard of an area involve generating a detailed assessment of the kinds of earthquake ruptures that can be expected along each fault, a complicated process that relies on supercomputers to generate a final model. By contrast, the new method—developed by Caltech graduate student Chris Rollins and Jean-Philippe Avouac, Earle C. Anthony Professor of Geology and Mechanical and Civil Engineering—is much simpler, relying on the strain budget and the overall earthquake statistics in a region.
“We basically ask, ‘Given that central L.A. is being squeezed from north to south at a few millimeters per year, what can we say about how often earthquakes of various magnitudes might occur in the area, and how large earthquakes might get?'” Rollins says.
When one tectonic plate pushes against another, elastic strain is built up along the boundary between the two plates. The strain increases until one plate either creeps slowly past the other, or it jerks violently. The violent jerks are felt as earthquakes.
Fortunately, the gradual bending of the crust between earthquakes can be measured at the surface by studying how the earth’s surface deforms. In a previous study (done in collaboration with Caltech research software engineer Walter Landry; Don Argus of the Jet Propulsion Laboratory, which is managed by Caltech for NASA; and Sylvain Barbot of USC), Avouac and Rollins measured ground displacement using permanent global positioning system (GPS) stations that are part of the Plate Boundary Observatory network, supported by the National Science Foundation (NSF) and NASA. The GPS measurements revealed how fast the land beneath L.A. is being bent. From that, the researchers calculated how much strain was being released by creep and how much was being stored as elastic strain available to drive earthquakes.
The new study assesses whether that earthquake strain is most likely to be released by frequent small earthquakes or by one very large one, or something in between. Avouac and Rollins examined the historical record of earthquakes in Los Angeles from 1932 to 2017, as recorded by the Southern California Seismic Network, and selected the scenario that best fit the region’s observed behavior.
“Estimating the magnitude and frequency of the most extreme events, which can’t be assumed to be known from history or instrumental observations, is very hard. Our method provides a framework to solve that problem and calculate earthquake probabilities,” says Avouac.
This new method of estimating earthquake likelihood can be easily applied to other areas, offering a way to assess seismic hazards based on physical principles. “We are now refining the method to take into account the time distribution of past earthquakes, to make the forecasts more accurate, and we are adapting the framework so that it can apply to induced seismicity,” Avouac says.
The study is titled “A geodesy- and seismicity-based local earthquake likelihood model for central Los Angeles.”