 A little over a decade ago, Merck & Co. outspent Google on research and development. Merck still led in 2013, with $7.5 billion against Google’s $7.1 billion. Google pulled ahead in 2014, spending $9.8 billion against the $7.2 billion Merck reported in its 2014 annual report.1
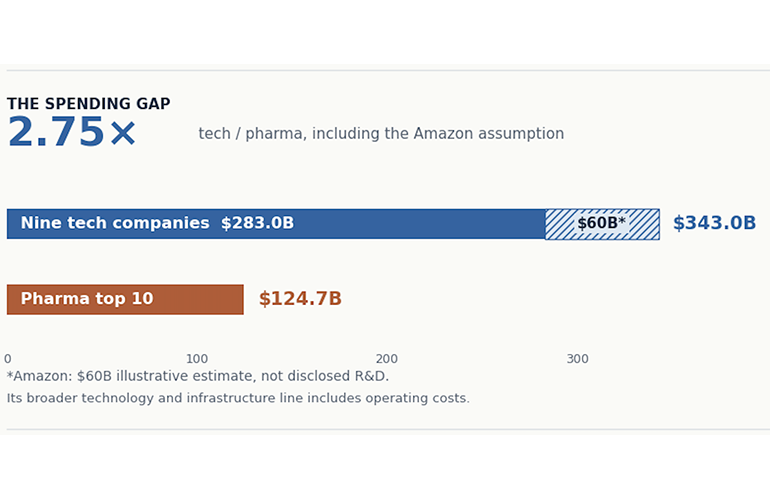
Big Tech’s R&D spending has only continued to climb. In 2025, nine technology companies, excluding Amazon, spent roughly $283 billion on R&D, more than twice the $124.7 billion spent by pharma’s top 10. Amazon doesn’t break out R&D, folding it instead into a broader “technology and infrastructure” line. Adding a ballpark estimate of $60 billion for Amazon would bring the technology total to $343 billion, about 2.75 times the pharma figure.
Among companies that report R&D as a line item, Alphabet leads at $61.1 billion. Meta, which reported $57.4 billion, is close behind. Together, the two spent $118.5 billion, roughly 7.5 times Merck’s $15.8 billion and 8.9 times Eli Lilly’s $13.3 billion.
On the 2026 innovators list
OpenAI, NVIDIA, Alphabet, Meta and Eli Lilly are among R&D World’s 100 most innovative companies of 2026. The list examines what each company built, who is using it and the results it has reported. R&D World will publish the full comparison in the 2026 Global R&D Funding Forecast.
NVIDIA raised R&D spending 43% to $18.5 billion in its fiscal year ended Jan. 25, 2026, according to its annual report. Its total exceeded the $15.8 billion Merck spent and the $13.3 billion Lilly spent in 2025. OpenAI spent about $19 billion on R&D in 2025 while generating $13 billion in revenue, the Financial Times reported in its examination of the company’s finances ahead of an anticipated IPO. Its research spending exceeded revenue by approximately $6 billion.
Merck devoted 24.3% of its 2025 sales to R&D, AstraZeneca 24.2% and Lilly 20.5%. Meta topped all three at 28.5%. NVIDIA’s ratio stood at 8.6%, as revenue grew 65% while R&D spending rose 43%.
Drugmakers, for their part, are increasingly paying for access to what Big Tech builds, and the pace is accelerating. The total value of pharma AI partnerships jumped 120% from 2024 to 2025, according to GlobalData figures. The deals are also widening in scope. In January, NVIDIA and Lilly said they would jointly invest up to $1 billion over five years in a Bay Area AI lab. In April, Merck committed up to $1 billion to a multiyear Google Cloud partnership spanning R&D, manufacturing, commercial and corporate functions. Novo Nordisk has now signed with three AI providers this year: OpenAI in April, Amazon Web Services and, on Sept. 16, Anthropic.
1 Motorola accounting: Google’s 2014 annual report classified Motorola’s handset business as discontinued operations following its October 2014 sale to Lenovo and presented the earlier comparative periods on the same basis. The R&D figures used here therefore exclude that business: $7.137 billion in 2013 and $9.832 billion in 2014, per Google’s 2014 Form 10-K.
Methodology and sources
Figures are 2025 R&D expense as reported in company filings, in U.S. dollars. The comparison covers selected large companies rather than full sector totals. Fiscal years vary: Microsoft’s ended June 30, 2025, and NVIDIA’s ended Jan. 25, 2026. Non-US figures are converted at annual-average exchange rates.
Tech ($283.0 billion): Alphabet, Meta, Apple, Microsoft, Huawei, Samsung Electronics, NVIDIA, Intel and Tencent. OpenAI, a private company, is excluded.
Pharma ($124.7 billion): Roche, Merck, Johnson & Johnson, AstraZeneca, Eli Lilly, Novartis, Pfizer, Bristol Myers Squibb, GSK and AbbVie. Totals are company-wide: Roche includes diagnostics, and J&J’s $14.7 billion includes $2.8 billion from its medtech segment. Counting J&J’s pharmaceutical R&D alone would slightly widen the gap.
Amazon: Amazon does not disclose R&D. It reported $108.5 billion in technology and infrastructure expense, which also covers costs such as depreciation, rent and utilities. The $60 billion used here is an illustrative estimate.
R&D as a share of revenue divides reported R&D by total revenue. Meta’s figures come from its full-year 2025 results; other ratios use the filings linked above.
2013–2014 comparison: Google figures are restated to exclude Motorola’s handset business, per Google’s 2014 Form 10-K. Merck figures come from its 2014 Form 10-K.

Tell Us What You Think!
You must be logged in to post a comment.