 With this report, R&D World magazine presents — for the 61st time — its annual global R&D funding forecast. This forecast presents unique data on the cumulative resources expected to be invested over the next twelve months by more than 115 countries, numerous industries, universities and governments and innumerable technologies. The world and the science and technologies created in R&D labs have seen dramatic changes since our first $12 billion R&D forecast was created in January 1959 (in R&D World magazine’s first issue). And those technology and economic changes continue to amaze and astound our editors. For 2020, those changes are expected to result in the investment of more than $2.4 trillion in R&D on a global basis, a monetary increase of 2.7%, or $64 billion, over what was invested by those same organizations in 2019.
(Click on any of the graphics in this article to enlarge them.)
The editors of R&D World forecast current and future global spending trends by collecting data on global and industrial economies from a large number of sources; including the International Monetary Fund’s (IMF’s) October 2019 World Economic Outlook, the Central Intelligence Agency’s (CIA’s) World Fact Book, the Organization for Economic Cooperation and Development’s (OECD’s) country databases, the U.S. National Science Foundation’s (NSF’s) National Center for Science and Engineering Statistics (NCSES) and the World Bank’s economic databases among numerous other sources and reports (a full listing of resources and contact information is provided at the end of this report). Much of this forecast is based on global economies and in particular each country’s current gross domestic product (GDP) and past R&D spending trends. All country data has been normalized to purchasing power parity (PPP) values to establish a consistency between differing currencies. Data and trends included in this report also contains the results of multiple R&D World magazine reader surveys deployed from July to September 2019.
This report is provided as a resource for R&D managers and senior researchers who are preparing/reviewing their 2020 R&D budgets to establish a baseline for their current and future analyses. Readers interested in specific budgeting trends may be interested in viewing the last section of this report on how to create an R&D budget. This data is mostly industrial and based primarily on the R&D World magazine reader survey results from more than 2,000 respondents.
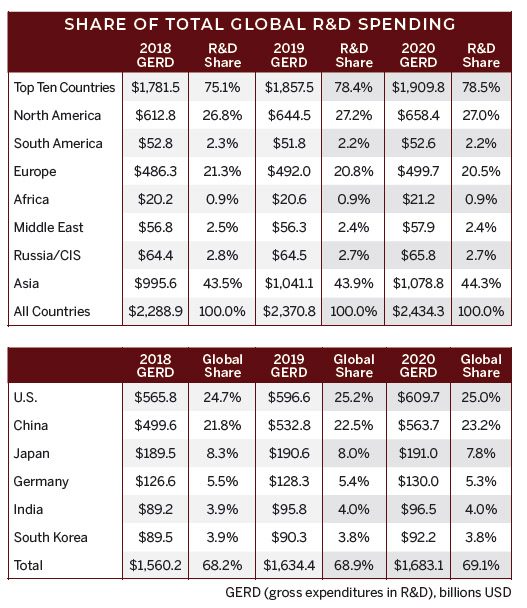
As shown in the attached tables in this section, R&D investments are distributed throughout the world with Asian countries continuing to grow market share due primarily to the escalating investments by China’s government, industries and universities. While U.S. organizations continue to lead in global spending, as they have for more than 50 years, China is inching ever closer to becoming the leading global R&D investor and is forecast to surpass total U.S. spending by no later than 2025 if current spending trends continue (see the International section of this report for more details). Asia is now the largest R&D investing region in the world with more than 44% global R&D share. Asia is gaining about a half-percent share each year in global R&D share and at this rate could account for more than half of all R&D investments before 2030. China, in particular, continues to build its R&D infrastructure and manpower capabilities with no letup in spending, desire or long-term planning.
Third-world countries including many in South America and Africa continue to languish in their R&D investments, and their economic growth languishes as a result. All of South America and Africa combined are only responsible for less than 5% of the total global R&D spent while they have more than 20% of the world’s population. As noted in the nearby table, the top six R&D spending countries (U.S., China, Japan, Germany, India and South Korea) are responsible for nearly 70% of all global R&D investments. In 2019, the U.S. and China invested nearly half of all global R&D monies. And the U.S. government (with its $163 billion in R&D funding) alone invests more R&D monies than all other individual countries except China and Japan.
The science of R&D investing
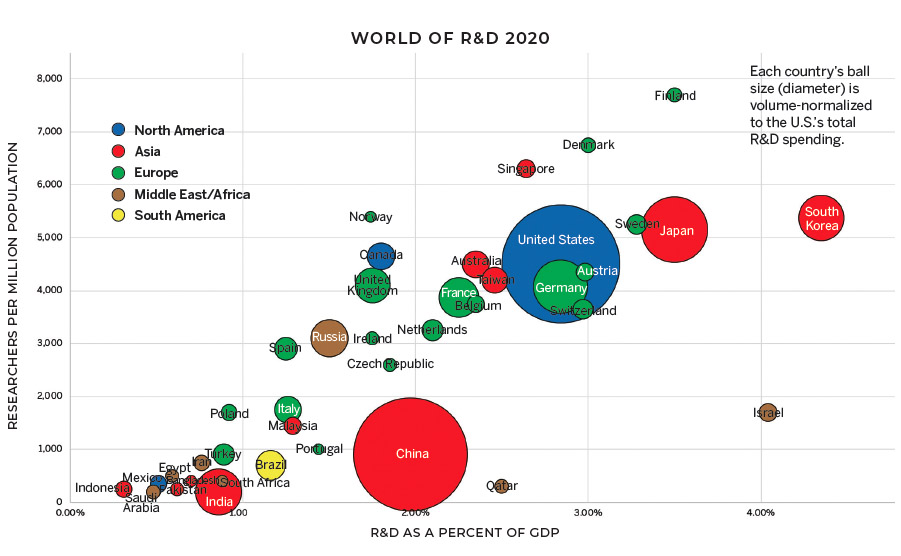
The chart World of R&D 2020 (below) provides a graphic of the overall relationship of R&D spending, resources and economic relationships between the top 40 R&D investing economies of the world. In this “ball chart” the size (diameter) of the ball relates to the overall amount of R&D invested by each of the top 40 R&D investing countries. Each country’s ball size (diameter) is volume-normalized to the U.S.’s total R&D spending. The location of the ball on the horizontal axis signifies the R&D invested by the country as a function of it gross domestic product (GDP). The location of the ball on vertical axis signifies the number of researchers within each country as a ratio of the country’s total population.

For example, while the size of China’s ball is close to the size of the U.S.’s ball, it is lower on the vertical scale because of its large overall population and hence lower ratio of researchers to population. China actually graduates more new engineers annually than the total number of engineers in the U.S. China’s ratio of R&D as a percent of GDP also is lower than that of the U.S. but has been gaining over the past several years. China’s current five-year plan has a goal of continuing to increase this ratio.
The two outliers in this chart — Finland with its high researcher/population ratio of more than 7,000 and Israel with its high R&D as a percent of GDP of 4.0 — are historically consistent and have not changed significantly over the past five years.
The table titled Forecast Gross Expenditures on R&D lists the top 40 R&D spending countries with 2018 actual values of GDP, R&D as a percent of GDP and GERD (gross expenditures on research and development), 2019 estimated values, and 2020 forecast values, for each top-40 country. The top 40 countries are ranked by 2020 GERD values. GDP and GERD values are listed in purchasing-power-parity billions of U.S. dollars.
Each year’s totals for the rest of the world countries are shown at the bottom. Values for 116 total countries were calculated. These countries are shown in individual R&D investment tables in the international section of this report — they are merely totaled for this table.
The top 10 rankings of this table have not changed significantly over the past 10 years. Some countries have shuffled slightly by one ranking number, but countries have maintained their relative positions. India, for example, has slowly moved up in the rankings and is No. 5 in 2020, while sitting at No. 8 in our 2014 Global R&D Funding Forecast. China rose from No. 3 in our 2010 Global R&D Funding Forecast to No. 2 in our 2011 R&D Funding Forecast, surpassing Japan by about $9 billion in R&D funding. While China has been growing its R&D by nearly 10% annually over the past 15 years, Japan has been growing its R&D investments by less than 2% annually. (Some years actually had no growth.)
 It should be noted that R&D investments are a function of both GDP and a ratio of R&D investments as a function of GDP. Looking at the top 40 table, some countries may have a smaller GDP than other countries but still spend more on R&D because they spend a larger percentage of their GDP on R&D investments. This is what held up India’s ranking in this table for many years — i.e., it had a relatively large GDP of about $10 trillion, but its R&D as a percent of GDP was consistently less than 1.0%. Its recent R&D as a percent of GDP has only risen slightly, but its overall GDP has grown to more than $11 trillion. Therefore, its net R&D investment has grown to nearly $100 billion and raised its global ranking.
The European economic malaise over the past ten years has also had an effect on its member states’ R&D investments with several of them, notably France and Italy falling in the global rankings, while other countries moved up as a result of an increased disposition for investing in R&D.
Israel has consistently had an R&D as a percent of GDP in the 4% range and thus is listed relatively high in the overall rankings despite a relatively small GDP of slightly less than $400 billion. Mexico, on the other hand, has a GDP in the $2.5 trillion range, but only invests about 0.5% of this GDP in R&D and thus falls farther down the ranking list below Israel. Mexico invests about $3 billion less in overall R&D than Israel.
In the overall country rankings, we made an effort to include all aspects of each country’s R&D. Much of these data are readily available in conventional publications and databases. Some, though, is harder to come by. This is particularly so for military and defense R&D efforts in countries which are historically secretive about this aspect of their R&D, as with Russia, Iran and China. Rough editorial estimations are made in these instances via the best data available. The worst of these instances are North Korea and Cuba, where little or no data are available except through historically established partial databases like those available at the World Bank.
The types of R&D
 Research and development efforts have historically (since before World War II) been categorized into three sections — basic research, applied research, and development work. The U.S. National Science Foundation (NSF) has been the caretaker of these statistical disciplines since WWII. The NSF was actually created as an offshoot of the Office of Scientific Research and Development (OSRD) headed by Vannevar Bush in WWII.
Data, definitions, sources and performance on the three aspects of R&D have historically been maintained by the NSF in various documents and reports, notably the National Patterns of R&D. A fourth aspect, Applied Development, which concerns specific efforts made to bring products to the marketplace, has been discussed with relatively little historical data. R&D World magazine has started building a database on Applied Development through its series of reader surveys deployed over the past several years. Applied Development is not mentioned specifically in the 2020 Global R&D Funding Forecast.
Data outlined in the NSF’s National Patterns reports describe in detail the sources and performers of R&D and its basic research, applied research and development components. Both the sources and performers are further detailed into industry, government, FFRDC (federal funded R&D centers), non-profit organizations and academia. The NSF has the resources (it uses Department of Labor-supported survey mechanisms) to collect and tabulate this data on an annual basis. Most other countries do not have the resources to collect this level of data. The OECD attempts to collect as much data as is practical from its 30-odd member states, but even then, this is usually only partial data sets.
This article is part of R&D World’s annual Global Funding Forecast (Executive Edition). This report has be published annually for more than six decades. To purchase the full, comprehensive report, which is 58 pages in length, please visit the 2020 Global Funding Forecast homepage.