Tracktable
Category: Software/Services
Developers: Sandia National Laboratories
United States
Product Description:Previous methods for analyzing trajectories were focused on complex one-to-one geometric comparisons using curve alignment. This limited both the type and number of trajectories that could be analyzed. Sandia National Laboratory developed, Tracktable’s patented representation techniques dramatically increase this limit from hours or days of data to many years. This enables analysis of patterns of activity that aren’t even visible with previous approaches. Moreover, Tracktable’s expressive analysis capability helps the computer identify things worth users’ attention instead of requiring them to forage through a mountain of noise in the hope of finding scarce signals. In addition to national security applications, we have applied Tracktable to the problem of eye tracking: where is the user’s gaze focused on a screen? The shapes of gaze patterns respond to the same sorts of analysis as moving objects. Tracktable applies in any field where motion data is common. With GPS data now ubiquitous, this includes wildlife tracking, traffic analysis, airspace management, and even comparing runners’ daily meanderings. Tracktable’s expressive power and scalability provide the next generation of capability for trajectory analysis applications.
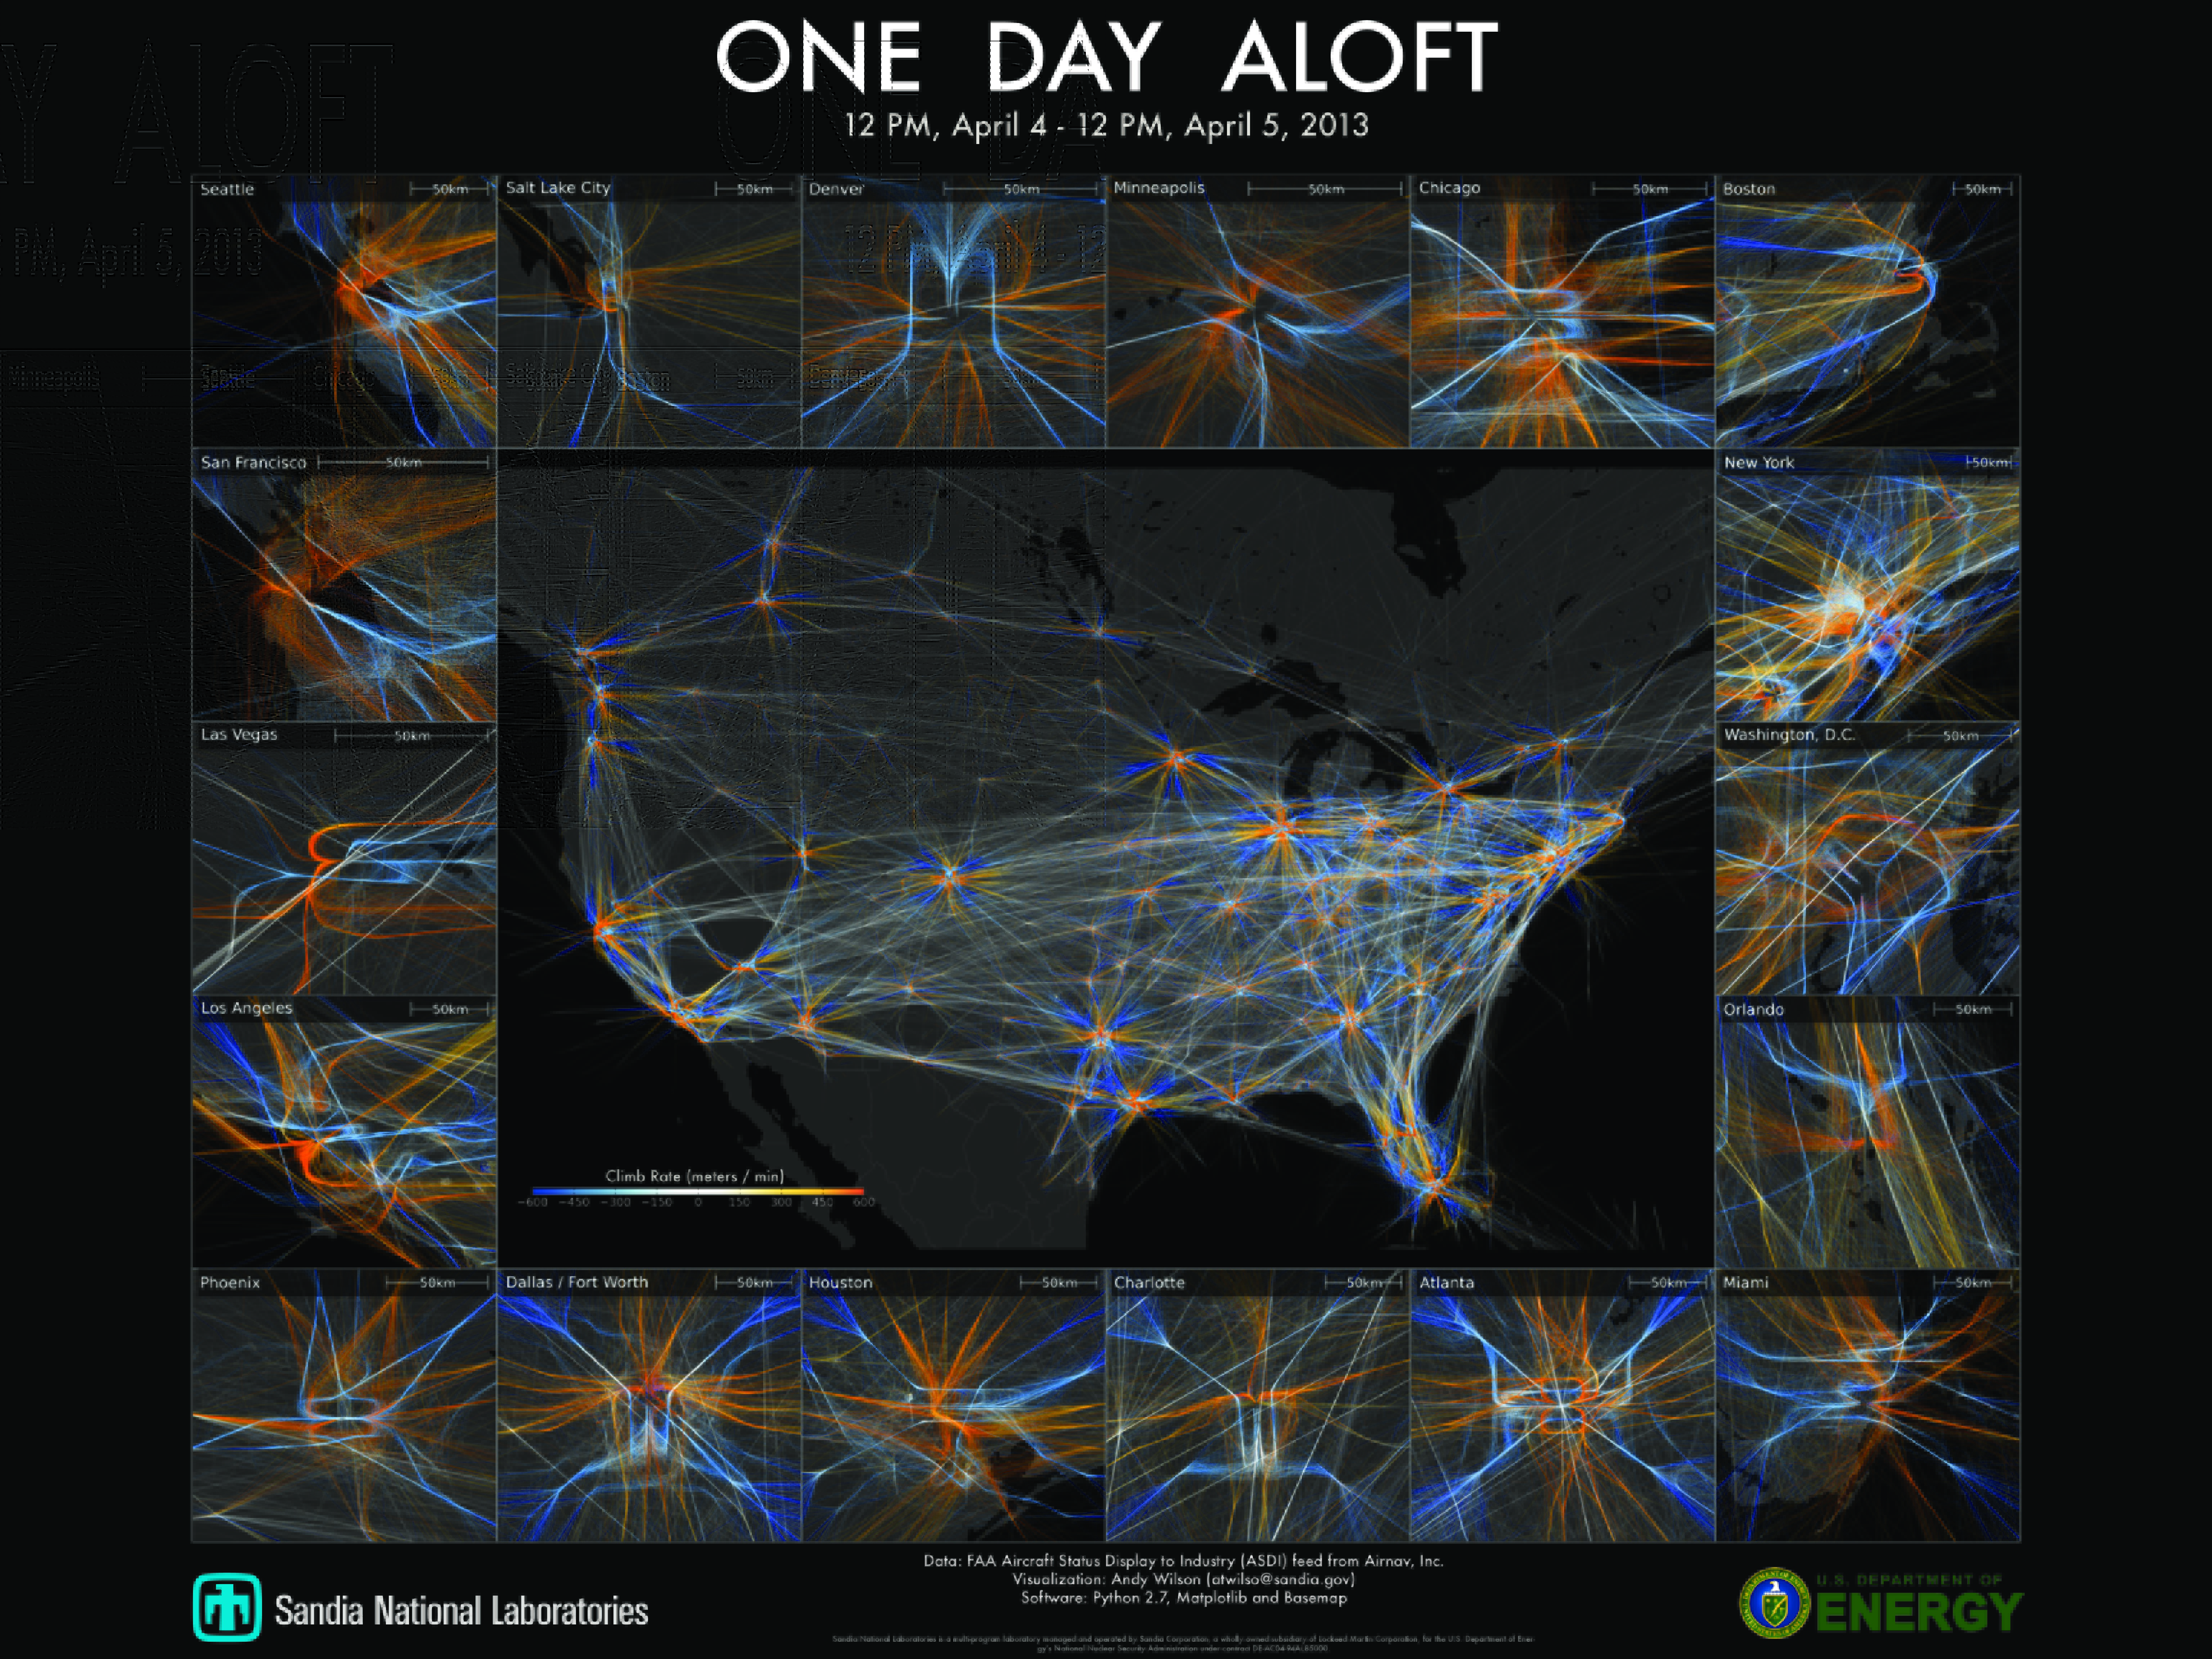
These images show approach and departure patterns at airports around the US. Descending (arriving) aircraft trajectories are drawn in blue. Ascending (departing) trajectories are drawn in orange. These are examples of patterns of activity that only fully materialize in larger data sets like the ones Tracktable can handle.