By Marwan Alsarraj, BioPharma Segment Manager, Digital Biology Group
As of 2021, there were 8.8 million scientists worldwide, and all their research generates data. The number of scientists continues to rise, too, resulting from the analytical-minded wanting to help the world counteract crises like the Covid-19 pandemic and climate change. The adage would claim that many hands make light work, but that’s only partly true: scientific progress also can’t happen without reliable instruments that produce accurate data. Conducting research is a logical, stepwise process. Data from each experiment guide each step the study will take next.
Scientists carefully design and run their experiments to acquire the highest quality data. However, as technology grows within the life science industry to accelerate research and development, they also rely heavily on instruments within the lab, such as digital PCR (dPCR) technology, to take clear informative measurements. Unfortunately, not all instruments provide good data; some generate bad data that is unclear or hard to interpret. (Figure 1) Things can get ugly when experiments produce multiple types of low-quality data, making it difficult for scientists to feel confident in their results and unclear how to proceed in their research.
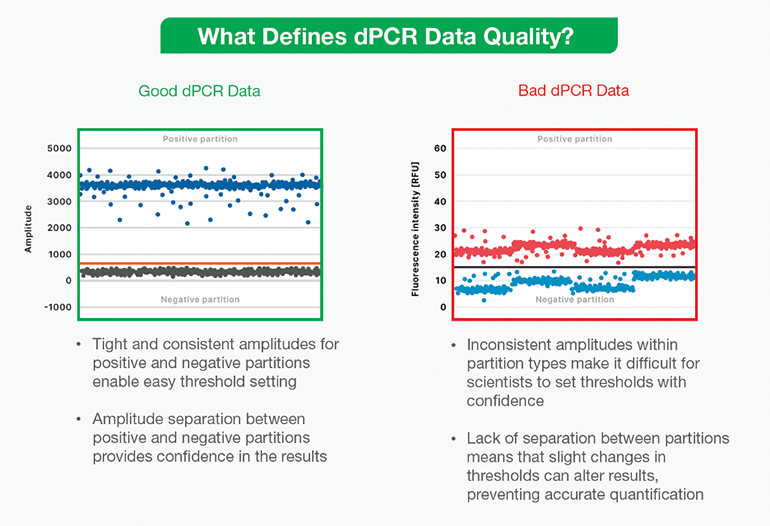
Figure 1 (Image from Bio-Rad)
Compounding the challenge of interpreting bad data, scientists must understand the strengths and weaknesses of all specialized instruments inside and out. dPCR instruments, for example, come with various considerations to optimize experimental results that this article will explore below.
Digital PCR and ultrasensitive DNA quantification
As part of the family of PCR methods, dPCR technology amplifies nucleic acids but offers some significant advantages over other PCR technologies. The dPCR method is robust, displaying high tolerance to PCR inhibitors. Furthermore, researchers may run multiplexed dPCR assays to save time and reagents. The high sensitivity of dPCR assays comes from an initial step in the method, which partitions the sample into thousands of different reactions, either on a microfluidic chip, across a microarray, in qPCR-like microfluidic plates, or Droplet Digital PCR (ddPCR) that occurs within oil-water emulsions. The goal is for each partition to contain one or a few DNA strands. After partitioning, the reaction undergoes a typical thermocycling reaction in which target nucleic acids produce a fluorescent signal. After the reaction reaches its endpoint, positive and negative partitions are quantified and analytics software is used to perform Poisson statistics that determine the original number of target nucleic acid molecules in the sample.
Unlike qPCR methods that require the researcher to run a standard curve alongside samples to interpret results, dPCR technology provides precise, absolute quantification of DNA. The need for a standard curve introduces more potential for human error, making qPCR assays less sensitive and reducing the reliable detection limit to above one percent of target species. In contrast, dPCR assays have much higher sensitivity and a higher limit, ideal for samples containing less than one percent of target species. That said, the sensitivity, specificity, and limit of detection of dPCR assays may all be affected by nuances of the system they’re running on that may affect the quality of data they produce.
While it’s true that researchers need results fast, at low cost, and with a low sample-to-result time and low-complexity workflow, there are other parameters to consider when selecting a dPCR system. Researchers should look for qualities that ensure the system will reliably produce good data each time they run an experiment.
Reading the dPCR data
dPCR data output appears as “positive” and “negative” points on a graph, separated by a threshold line. (Figure 1). Researchers should be wary of instruments and assays that produce data displaying poor separation and noise, making it difficult to draw a threshold between positive and negative droplets. Not having good separation could mean several things are wrong with the reaction: an inhibitor may have affected it, or the assay or instrument might be faulty. Any time this kind of bad data occurs, scientists may need to repeat experiments at additional cost, not to mention the price of the user’s valuable time. Instead, ideal results should show an obvious separation between the positive and negative partitions so that the user may categorically set a threshold bar between the two. Only then can users feel confident in the results, whether the data guide the next experiment, help diagnose a patient, or detect a pathogen in wastewater.
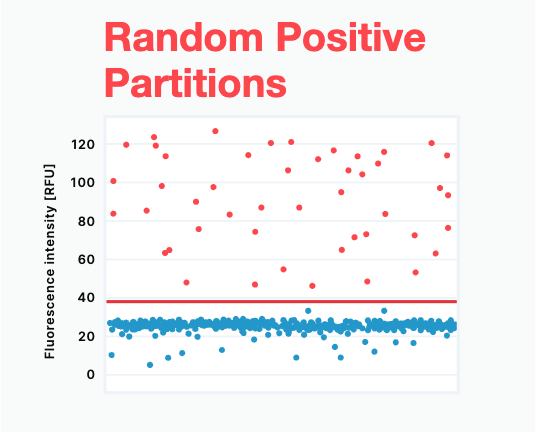
Figure 2A
Random positive partitions, or “rain,” are common phenomena that complicate dPCR data interpretation. In this situation, positive droplets vary widely in fluorescence intensity, making it difficult to determine which of those in the mid-region of the plot are positive. (Figure 2A) This phenomenon occurs when nucleic acid amplification within the dPCR assay occurs at a variable rate across partitions and may be a sign of poor sample partitioning, a low specificity assay, or instrument noise. As a result, dPCR assays that produce random positive partitions are less sensitive, with a reduced limit of detection.
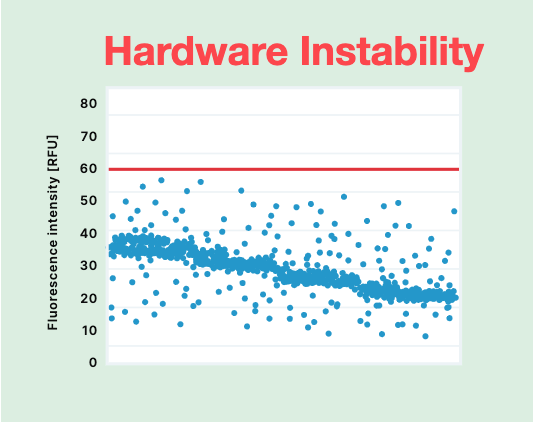
Figure 2B
Hardware instability of the dPCR instrument itself may also lead to less-than-clear data, where varying amplitudes within partitions make it challenging to know where to draw the threshold line. (Figure 2B) Data produced on unstable hardware may yield false positive and false negative results and show reduced sensitivity. Ultimately, the only way to make sense of results may be to seek an advanced user to spend time deciding where the cutoff should be and extrapolating the results. However, bringing human interpretation into the interpretation of a dPCR experiment also introduces the potential for human error.
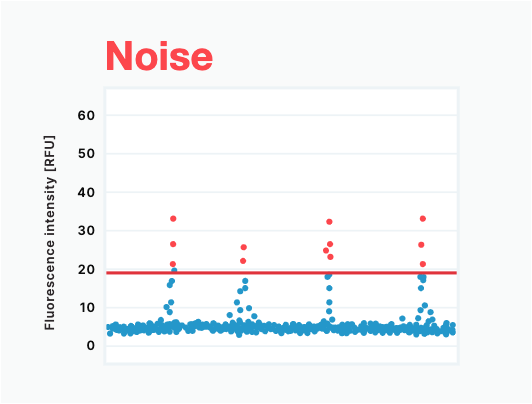
Figure 2C
Noise appears as clusters of negative data points above the threshold. It is often the result of solid or bubble contaminants or other optical issues within the instrument. (Figure 2C) Along the same lines, inferior optics technology can result in optics instability that also generates noise (Figure 2D). When data is noisy, only a highly trained user can make sense of results; however, this turns what should be a simple, automatic process into a manual one, taking up their valuable time.

Figure 2D
Finally, cross-contamination, where the target nucleic acid template has migrated from one sample to another, can be a serious issue that leads to a different kind of bad data. Here, positive data points appear, clearly separated from the negative data points by a threshold — but the positive signal came from a neighboring reaction. (Figure 2E) Cross-contamination may occur due to environmental factors, user error, or instrument-induced sample dispersion. Assays run on plate chips, and microarrays are more prone.
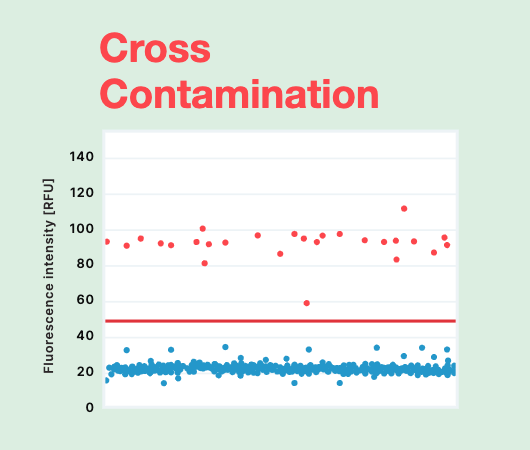
Figure 2E
On the other hand, ddPCR assays performed in water oil emulsions are not disposed to cross-contamination because droplets are wholly isolated from one another by oil. One way to determine if cross-contamination is happening in an assay is to examine no-template controls, which should produce no positive data points. However, because cross-contamination produces truly positive droplets, the results can be nearly impossible to interpret accurately, yielding false positives, reduced detection limit, and reduced sensitivity, especially for low-copy number samples.
Any of these issues may arise alone or in combination, further complicating the process of interpreting and drawing value out of each experiment.
Choosing a reliable instrument that delivers good data
Overall, low-quality data creates needless uncertainty in the research process. It also places responsibility on the user to make case-specific decisions when interpreting results, introducing a wildcard into a research study’s or test’s outcome. To avoid low-quality data, scientists should consider seeking a dPCR system and assays with the following beneficial qualities.
For the best flexibility and to save time, choose a dPCR system with an efficient workflow that minimizes hands-on time and is compatible with a wide selection of kits, assays, and reagents. An ideal system will also use powerful, intuitive analysis software that runs seamlessly on any computer, and from novice to expert, results should be easy for any user to interpret. A time-tested system with a track record of reliability will meet these needs, but an expert support team should be available to assist with questions if needed.
Instrumentation and accompanying assays should offer the following:
- No instrument-related cross contamination
- A stable optical bench and high-quality optics
- A design that produces consistent partitions of known size
- High target amplification efficiency
- High target specificity
- A strong signal when amplifying the target of interest
- A Large dynamic range for each detection channel
Researchers must always consider their own lab’s specific needs and constraints when choosing an instrument. For instance, they should consider how sensitive assays must be to detect their targets of interest. Due to their unique designs, different systems run assays of differing sensitivity, and researchers should be sure to choose a system that is sensitive enough for their experimental purposes. However, while the upfront price is important, they should also factor into the equation the potential cost of having to repeat experiments due to bad data.
With the best quality instruments, researchers can get closer than ever before to absolute precision and accuracy in their results, towards the goal of no false positive or false negative results — just answers. With a versatile and reliable dPCR system, they can do just that. Across fields and applications, good dPCR data provides insight into the large changes and small shifts that occur in nature and is a crucial step toward achieving a more comprehensive view of the genetics that govern biology.