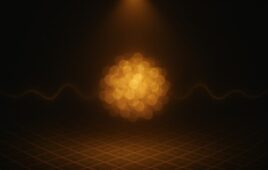
Using extremely faint light from galaxies 10.8-billion light-years away, scientists have created one of the most complete, 3-D maps of a slice of the adolescent universe. The map shows a web of hydrogen gas that varies from low to high density at a time when the universe was made of a fraction of the dark matter we see today.
The new study, led by Khee-Gan Lee and his team at the Max Planck Institute for Astronomy in conjunction with researchers at Lawrence Berkeley National Laboratory and the Univ. of California – Berkeley (UC Berkeley), will be published in an upcoming issue of Astrophysical Journal Letters.
In addition to providing a new map of part of the universe at a young age, says David Schlegel of Berkeley Lab, the work demonstrates a novel technique for high-resolution universe maps. The new technique, which uses distant galaxies to backlight hydrogen gas, might inform future mapping projects, he says. One such project could be the proposed Dark Energy Spectroscopic Instrument (DESI). Managed by Berkeley Lab, DESI has the goal of producing the most complete map of the universe yet.
“DESI was designed without the possibility of extracting such information from the most distant, faint galaxies,” says Schlegel, “Now that we know this is possible, DESI promises to be even more powerful.”
The first big 3-D map of the universe was created using data from the Sloan Digital Sky Survey (SDSS), which began in 1998. Over the years, the survey has provided data to make a high-resolution map of the nearby universe, within about 1-billion light-years. Recent telescope upgrades have stretched our ability to map the universe to about 6-billion light years, but, according to Schlegel, it’s a fairly crude map with incomplete data in some areas. The next generation of maps will come from the DESI project, scheduled to begin operation in 2018 pending funding. DESI will allow scientists to visualize 10 times the volume of SDSS and will extend about 10-billion light years away.
Beyond 10-billion light-years, says Schlegel, the expectation was that the map would become sparse. The reason: Astronomers planned to use a familiar technique that uses the bright light of quasars, which are, unfortunately, scattered and few. The technique uses a phenomenon called Lyman-alpha forest absorption, which relies on the fact that vast clouds of hydrogen exist between Earth and distant quasars and galaxies. At a certain distance, as measured by the red shift of the light, astronomers can determine the density of hydrogen, based on the absorption of quasar light. The problem is that this only provides information about the presence of hydrogen along the line of sight, not over a larger volume of space.
“It’s a pretty weird map because it’s not really 3-D,” explains Schlegel. “It’s all these skewers; we don’t have a picture of what’s between the quasars, just what’s along the skewers.”
The researchers believe their new technique, which uses the faint light of numerous distant galaxies instead of that of sparse quasars, can fill in the gaps between these skewers.
Before this study, no one knew if galaxies further than 10-billion light-years away could provide enough light to be useful, Schlegel says. But earlier this year, the team collected four hours of data on the Keck-1 telescope during a brief break in cloudy skies. “It turned out to be enough time to prove we could do this,” Schlegel says.
Of course, the galaxies’ light was indeed exceedingly faint. In order to use it for a map, the researchers needed to develop algorithms to subtract light from the sky that would otherwise drown out the galactic signals. Schlegel developed the algorithm to do this, while Casey Stark and Martin White of UC Berkeley modified an existing algorithm, called a Wiener filter, to create the 3-D map within a minute on a standard laptop computer.
Because the project was a proof-of-concept, the researchers are planning future Keck-1 telescope time to extend the volume of space they map. “This technique is pretty efficient and it wouldn’t take a long time to obtain enough data to cover volumes hundreds of millions of light years on a side,” says Khee-Gan Lee.