[NVIDIA]
The next two strongest AI performers so far in 2024, Meta and Palantir, each have distinctive strategies for AI IP. Meta, with 97 patents across 5 jurisdictions as of October 2024, achieved a 142.6% stock return and $1.45T market cap through platform-focused AI integration. At the same time, Meta has been actively contributing to the open-source AI community, notably through its development and release of the Llama series of large language models (LLMs). The latest iteration, Llama 3.1, which debuted in July 2024, features 405 billion parameters,
Palantir has taken an efficiency-focused approach to AI innovation that emphasizes strategic deployment over patent volume. With just 7 AI patents across 2 jurisdictions to date in 2024, the mid-cap company achieved a 129.9% stock return in 2024, hitting a market cap of $109.5 billion. Q3 2024 revenue hit $725.5 million, marking a 30% year-over-year increase, with U.S. commercial revenue growing 54% to $179 million. The company’s Artificial Intelligence Platform (AIP), launched in 2024, integrates large language models into private networks for enhanced data analysis and decision-making. An August 2024 partnership with Microsoft aims to deploy these AI solutions on Azure for U.S. government agencies, including the Department of Defense.
Rolls-Royce may not be the first firm that comes in terms of AI, and the firm doesn’t have the nearly as many AI patents so far in 2024 as many of the other firms in the table below. But the company has had a long history with ML. Since 1999, it has used data-driven approaches for engine health monitoring, drawing data from more 11,000 engines to predict maintenance needs and reducing inspection time by 75%. To date in 2024, the company has six AI patents filed across two jurisdictions while achieving a 110.4% stock return. As a traditional industrial player, Rolls-Royce has a high patent intensity (0.10) among the top performers. These innovations contributed to strong financial performance, with an underlying operating profit of £1.1 billion for the first half of 2024 and a 14.0% margin. A January 2024 partnership with Aerogility to implement AI-based enterprise digital twin systems further demonstrates how Rolls-Royce’s focused AI strategy drives both technological advancement and financial returns.
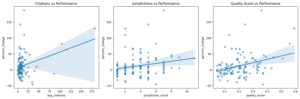
Patent quality metrics versus stock performance across 100+ public companies. While raw citation counts show mixed correlation with performance (left), the number of jurisdictions where patents are protected (center) and overall patent quality scores (right) show stronger positive relationships with stock returns. The quality score was calculated by averaging two normalized metrics—average citations and jurisdiction count—each weighted equally. The tentative conclusion from the data? Patent quality appears to matter more than quantity.
Looking beyond these top performers, our analysis of more than 100 public firms from a dataset of more than 900 prominent AI international patent-winning organizations reveals contrasts in innovation strategies as of October 2024. We found that patent volume itself shows little correlation with market performance — Intel leads in pure patent count with 1,212 AI patents across 11 jurisdictions but achieved a 36.2% return, while Netflix, with just 10 patents across 5 jurisdictions, posted a comparable 39% gain. The data also reveals sector patterns: traditional tech companies like Microsoft (329 patents) and Alphabet (488 patents) maintain broad patent portfolios but saw more modest returns of 41.8% and 39.6% respectively. Meanwhile, industrial players like BAE Systems tapped focused AI portfolios (18 patents) to drive value. The complete rankings below highlight how companies across different market caps and sectors are finding unique paths to AI innovation success.
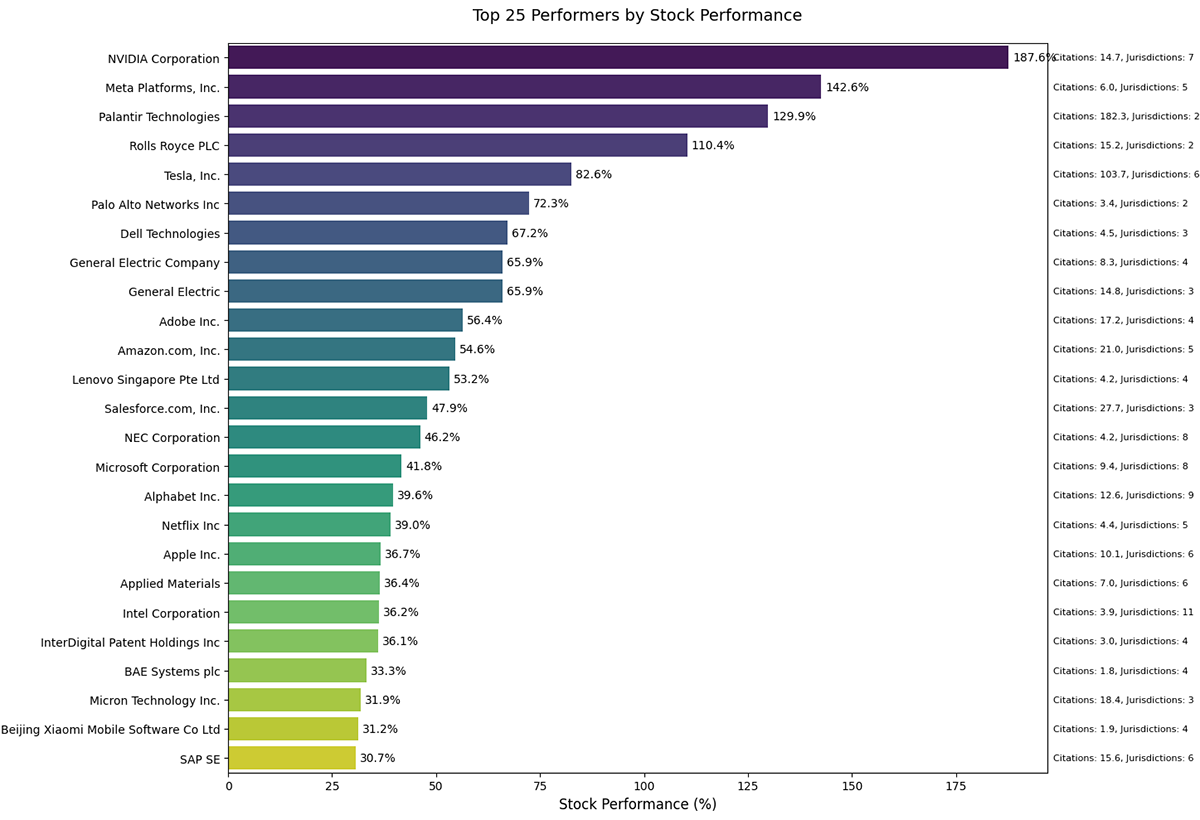
2024’s top 25 AI patent leaders by stock performance
| Company | Stock Return (%) | Total AI Patents | Market Cap ($B) | Revenue ($B) | Patent Intensity | Jurisdictions | Size Category |
|---|---|---|---|---|---|---|---|
| NVIDIA Corporation | 187.6 | 273 | 3432.0 | 60.9 | 0.08 | 7 | Large Cap |
| Meta Platforms, Inc. | 142.6 | 97 | 1445.1 | 134.9 | 0.07 | 5 | Large Cap |
| Palantir Technologies | 129.9 | 7 | 109.5 | 2.2 | 0.06 | 2 | Mid Cap |
| Rolls Royce PLC | 110.4 | 6 | 63.0 | 16.5 | 0.10 | 2 | Mid Cap |
| Tesla, Inc. | 82.6 | 17 | 807.1 | 96.8 | 0.02 | 6 | Large Cap |
| Palo Alto Networks Inc | 72.3 | 12 | 119.9 | 8.0 | 0.10 | 2 | Mid Cap |
| Dell Technologies | 67.2 | 209 | 91.2 | 88.4 | 2.29 | 3 | Mid Cap |
| General Electric Company | 65.9 | 55 | 189.7 | 68.0 | 0.29 | 4 | Large Cap |
| General Electric | 65.9 | 11 | 189.7 | 68.0 | 0.06 | 3 | Large Cap |
| Adobe Inc. | 56.4 | 203 | 214.1 | 19.4 | 0.95 | 4 | Large Cap |
| Amazon.com, Inc. | 54.6 | 154 | 2097.7 | 574.8 | 0.07 | 5 | Large Cap |
| Lenovo | 53.2 | 40 | 16.7 | 56.9 | 2.395 | 4 | Small Cap |
| Salesforce.com, Inc. | 47.8 | 60 | 284.4 | 34.9 | 0.21 | 3 | Large Cap |
| NEC Corporation | 46.2 | 250 | 22.1 | 3477.3 | 11.29 | 8 | Small Cap |
| Microsoft Corporation | 41.8 | 329 | 3059.2 | 245.1 | 0.11 | 8 | Large Cap |
| Alphabet Inc. | 39.6 | 488 | 2085.8 | 307.4 | 0.23 | 9 | Large Cap |
| Netflix Inc | 39.0 | 10 | 326.5 | 33.7 | 0.03 | 5 | Large Cap |
| Apple Inc. | 36.7 | 111 | 3377.6 | 391.0 | 0.03 | 6 | Large Cap |
| Applied Materials | 36.4 | 58 | 153.7 | 26.5 | 0.38 | 6 | Mid Cap |
| Intel Corporation | 36.2 | 1212 | 100.6 | 54.2 | 12.05 | 11 | Mid Cap |
| InterDigital Patent Holdings Inc | 36.1 | 29 | 4.3 | 0.5 | 6.78 | 4 | Small Cap |
| BAE Systems plc | 33.3 | 18 | 50.9 | 23.1 | 0.35 | 4 | Small Cap |
| Micron Technology Inc. | 31.9 | 78 | 117.0 | 25.1 | 0.67 | 3 | Mid Cap |
| Xiaomi* | 31.2 | 57 | 91.1 | 271.0 | 0.63 | 4 | Mid Cap |
| SAP SE | 30.7 | 101 | 276.3 | 31.2 | 0.37 | 6 | Large Cap |
Financial performance data from Yfinance. Patent data fetched using Google Cloud’s public patent data.
*Xiaomi data is incomplete, including Beijing Xiaomi Mobile Software Co Ltd patent subsidiary counts only.