A case study illustrating the use of airflow modeling software in the design of a pharmaceutical cleanroom.
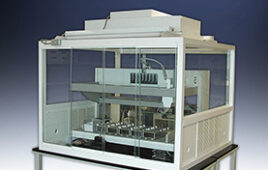
THE CASE STUDY SHOWN HERE was carried out by Tanvec and illustrates the use of FLOVENT® airflow modeling software to investigate and optimize the design of a complex pharmaceutical cleanroom. The end user was seeking to optimize the design of a cleanroom containing vial filling machines, lyophiliser loading, and automated transport systems. The pharmaceutical regulatory requirements demand the following cleanliness classes for different parts of the operation (see Table).
The main issue investigated was the size of unidirectional airflow clean zone required to protect exposed product as it is loaded from the transporter into the lyophiliser. In addition, it was necessary to identify an appropriate way to segregate this critical zone from the surrounding cleanroom area with non-unidirectional flow. The investigation was carried out in two distinct stages. The first stage was a broad investigation of basic room airflow configuration options. The second stage involved investigating detailed areas of airflow over critical product and material transfer locations where contamination control and regulatory compliance was essential. The two stage approach was adopted because it is difficult to predict all the issues and problems that will arise until some overall modeling has been developed, the solution run, and the data evaluated. This approach also reveals another advantage of airflow modeling — it is possible and often advantageous to look at a simplified representation of the macroscopic room level issues, as well as the more detailed flows around specific areas of interest. Conventional “Rule of Thumb” analysis of a conceptual design capable of achieving the required cleanliness classes above suggested that the corridor should have a filtered ceiling to achieve unidirectional airflow. The use of airflow modeling, however, allowed investigation into alternative methods of introducing air into the space.
Figure 1 shows the airflow modeled with a filtered ceiling across the full width of the corridor. The visualization technique shown is akin to a smoke test on a physical mock-up, but with three advantages. First, the computational smoke can be given a lifetime so that the room does not fill-up with smoke as it would do on a physical model. Second, the visualization can be colored according to parameters such as air speed, temperature, contamination level, etc. In the figures shown, the smoke is actually colored accordingly to y- (vertical component) velocity, with the color scale indicating downward direction velocities of >1m/s in blue and horizontal or upward flow >0m/s in red.
|
ACTIVITY
|
CLEANLINESS CLASSIFICATION
|
CLEANLINESS STANDARD
|
|
|
At Rest
|
In Operation
|
||
| Aseptic filling of vials | 100/M3.5/M3.5 ISO 5 Grade A |
100/M3.5/M3 ISO 5 Grade A |
US Fed Std 209E EN/ISO (FDIS) 14644-1 EC GMP Annex 1 vol. iv |
| Transport vials to Lyophiliser | 100/M3.5 ISO 5 Grade A |
100/M3.5 ISO 5 Grade A |
US Fed Std 209E EN/ISO (FDIS) 14644-1 EC GMP Annex 1 vol. iv |
| Loading vials into Lyophiliser | 100/M3.5 ISO 5 Grade A |
100/M3.5 ISO 5 Grade A |
US Fed Std 209E EN/ISO (FDIS) 14644-1 EC GMP Annex 1 vol. iv |
| Unloading vials from Lyophiliser | 100/M3.5 ISO 5 Grade A |
100/M3.5 ISO 5 Grade A |
US Fed Std 209E EN/ISO (FDIS) 14644-1 EC GMP Annex 1 vol. iv |
| Transport vials to oversealing | 100/M3.5 ISO 5 Grade A |
100/M3.5 ISO 5 Grade A |
US Fed Std 209E EN/ISO (FDIS) 14644-1 EC GMP Annex 1 vol. iv |
| Room surrounding the Aseptic processes | 100/M3.5 ISO 5 Grade B |
10,000 ISO 7 Grade B |
US Fed Std 209E EN/ISO (FDIS) 14644-1 EC GMP Annex 1 vol. iv |


Finally, this type of visualization can be done without the need for a physical mock-up of the space. This means that it is inexpensive and quick to do even at the conceptual stage of the design. With this design, a small recirculation region of air just in from of the top half of the lyophiliser was noticed. This was caused by air hitting the top of the lyophiliser and “bouncing” forming this vortex.
A profiled top was added to the lyophiliser and a plate installed in front of the unit to eliminate this recirculation as shown in Figure 2. With this modification, the transporter corridor was now satisfying the necessary standards. However, in many ways this design would have been unsatisfactory to the end user, especially in terms of running costs associated with the enormous volume of air being introduced into the space.
In an effort to reduce the volume of air, the room was divided in half with unidirectional airflow down over the critical interface region where the vials were transferred from the transporter into the lyophiliser. Figure 3 shows that, as expected, a large vortex formed above the transporter on the left-hand side of the corridor. This could have a detrimental effect on residence time of any contamination in the space and was therefore unsatisfactory. A dividing curtain was therefore placed down the center of the room and a perforated plate added to the non-critical zone on the left hand side of the corridor. Figure 4 shows how this improved the situation. The total volume of air was reduced by almost half along the length of the transporter corridor.


Design Optimization
These examples form just a small part of a quite comprehensive airflow modeling analysis of this particular space. The study enabled the following essentialelements of the design to be optimized:
- Reduction of the unidirectional flow clean-zone area by 50%. which enabled the total air volume required to ensure the correct clean-room cleanliness classes to be reduced by approximately 40% with the consequent significant saving of energy consumption.
- Selection of the correct type of diffuser in the non-unidirectional flow zone to ensure that the critical airflow is not disrupted.
- Resolution of basic dimensions required inside the vial transport system to avoid airflow updraft and vortex generation during vial transfer to/from the lyophiliser.
- Design of the lyophiliser door to minimize turbulence caused by the obstructions on the face of the door.
- Impact of location and air balance of the low-level room exhaust grilles.
- Supply air temperature effect on the airflow. The use of airflow modeling software enabled them to predict the behavior of the room airflow patterns exactly, even at the concept stage. It provided a clear guide to where to focus testing effort during HVAC system commissioning and allowed the model to be stored for any future design changes. Modifications could be made earlier in the design process with confidence of satisfying relevant standards.
Andrew Manning, Ph.D. is Director of Thermal Engineering at Flomerics,Inc.,4 Mount Royal Ave.,Suite 450,Marlborough,MA 01752. He can be reached at 508-357-2012 x124 or andy.manning@ flomerics.com. Andrew Manning obtained his B.Eng in Mechanical Engineering at the University of Nottingham in 1991,and his Ph.D.from the same university in 1994.He joined the UK office of Flomerics Ltd in 1994 as a Consultant Engineer,and transferred to the MA,US office in January 1997.
Flomerics provides software enabling engineers to test virtual models of theirequipment by computer simulation before building physical prototypes.