This year’s AI Index Report from Stanford University’s Institute for Human-Centered AI (HAI) paints a picture of an AI landscape accelerating at a startling pace, challenging simple narratives of an ‘AI bubble’ or progress deceleration. While the compute used in the largest training runs continues its exponential climb (historically doubling roughly every 3–4 months), the cost to deploy AI is simultaneously plummeting. Inference costs are falling like a rock. Specifically, they dropped over 280-fold in just 18 months for comparable performance. Mirroring this cost-performance dynamic are widening performance gaps between proprietary and open models. Similarly, U.S. and Chinese leaders are locked in intense competition at the frontier. For professionals in R&D, navigating this era of intense acceleration and capability compression requires close attention as the advances continue to have potentially significant repercussions throughout the STEM landscape. Here are standout findings of the report:
1. Hardware performance doubles every 1.9 years
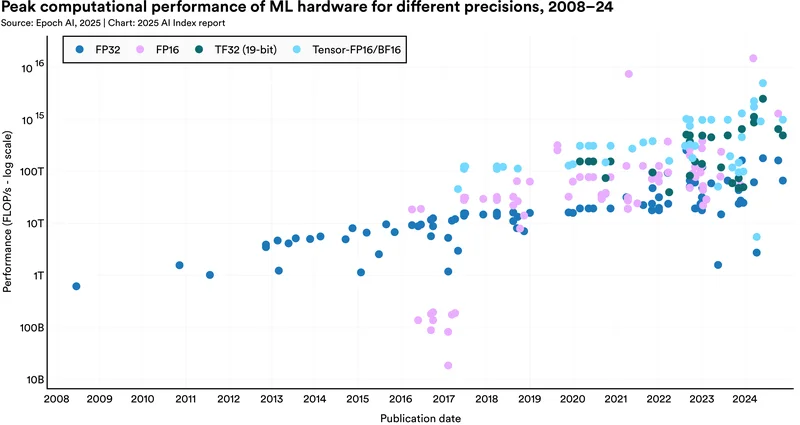
A primary engine of AI progress continues to fire on all cylinders. The report finds: “‘AI hardware gets faster, cheaper, and more energy efficient.” It adds: “New research suggests that machine learning hardware performance, measured in 16-bit floating-point operations, has grown 43% annually, doubling every 1.9 years.’ (Page 29, Highlight 8).” This improvement pace enables the training of larger models though there is a simultaneous trend towards extracting more performance through distillation and test-time compute approaches. The trend, however, doesn’t mean that AI clusters’ performance should be compared head-to-head against supercomputers, as the latter uses considerably higher accuracy.
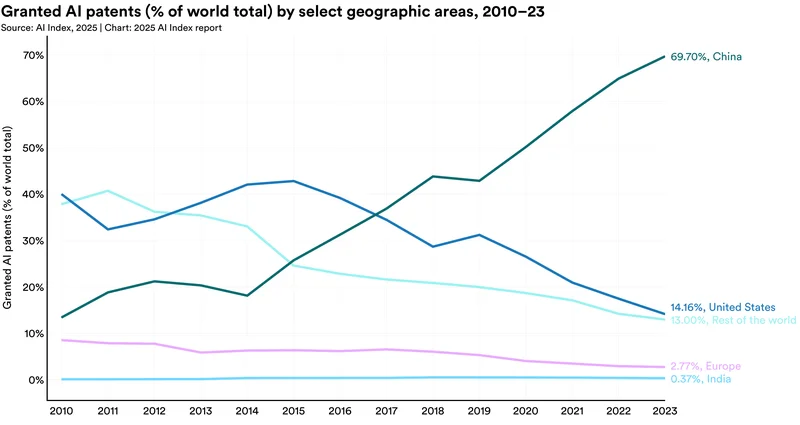
2. South Korea and Luxembourg lead AI patenting per capita
While China’s sheer volume of AI patents is unmatched (69.7% of grants in 2023), focusing on per capita figures reveals unexpected IP hubs. The report notes that “‘South Korea and Luxembourg stand out as top AI patent producers on a per capita basis.’ (Page 29, Highlight 7).” These nations foster environments conducive to generating novel AI-related intellectual property relative to their population size.
3. US produced the most notable AI models in 2024, but China overtook Europe
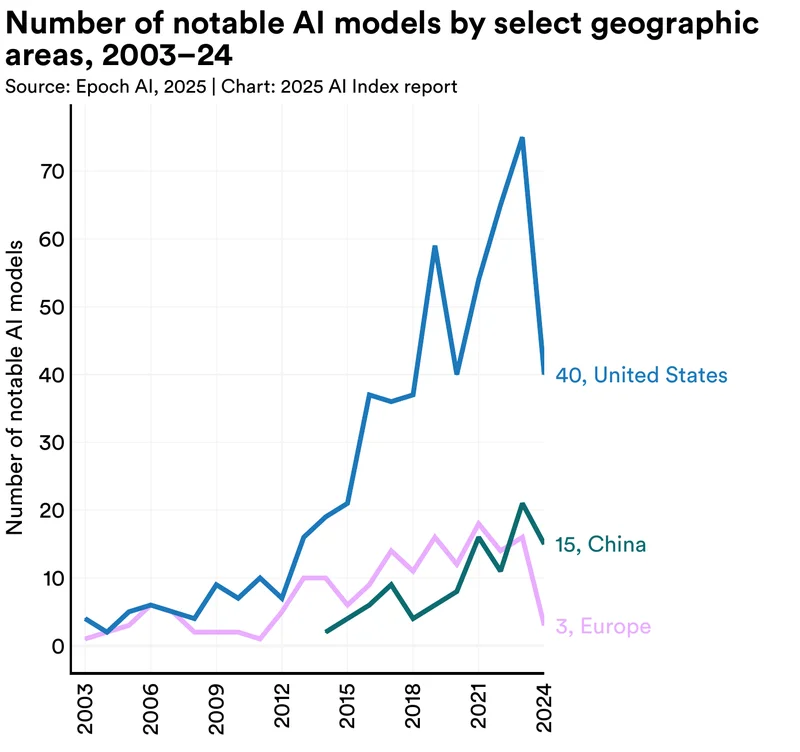
Historically, the U.S. has been the primary source of breakthrough AI models. This continued in 2024: “‘In 2024, U.S.-based institutions produced 40 notable AI models, significantly surpassing China’s 15 and Europe’s combined total of three.’ (Page 28, Highlight 4).” Yet the data also shows a shift, with China producing five times as many notable models as Europe in 2024.
4. East Asia leads publication volume, US leads in influential research
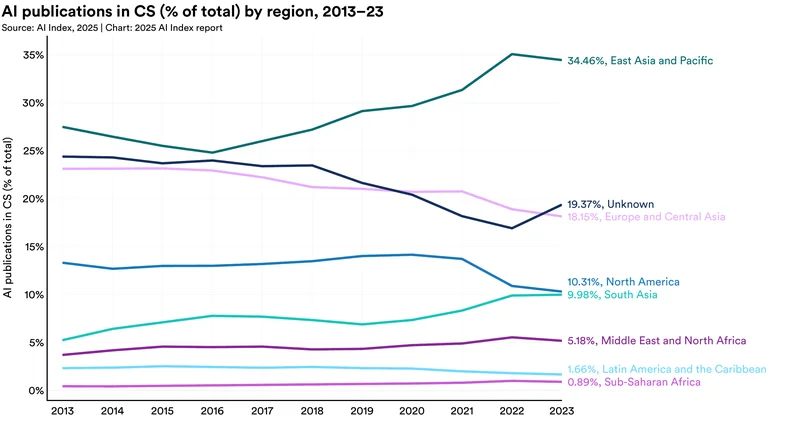
Looking at research output, a regional divergence appears. “‘In 2023, East Asia and the Pacific led AI research output, accounting for 34.5% of all AI publications, followed by Europe and Central Asia (18.2%) and North America (10.3%).’ (Page 33).” The report, however, also indicates the U.S. remains the leading producer of the most highly cited (top 100) publications (Page 28, Highlight 1), suggesting a potential contrast between research quantity (led by East Asia) and immediate high-impact influence (led by the US).
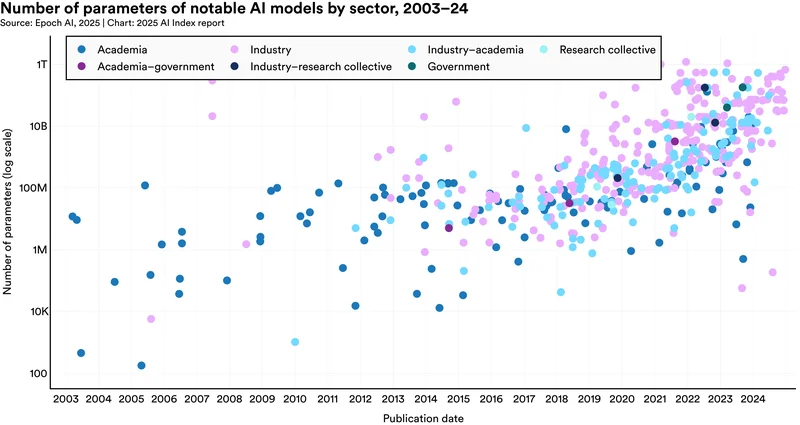
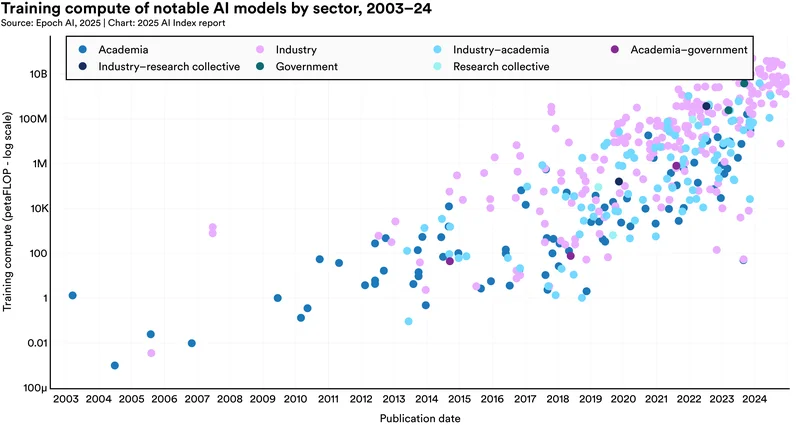
5. Industry deploys vastly more compute, widening the resource gap

Developing frontier AI models requires immense resources, increasingly concentrating this capability within industry. As the report states, “‘Creating cutting-edge AI models now demands a colossal amount of data, computing power, and financial resources that are not available to academia. Most leading AI models are coming from industry…’ (Page 58).” Figure 1.3.13 (Page 55) shows that industry almost exclusively deploys the highest training compute levels.
6. API access is the dominant release strategy for notable models
How are cutting-edge models made available? The data shows a clear preference for controlled access. “‘In 2024, API access was the most common release type, with 20 of 61 models made available this way, followed by open weights with restricted use and unreleased models.’ (Page 51).” This strategy allows developers to monetize and control use, but limits deeper inspection and customization.
7. China solidifies lead in AI publication volume
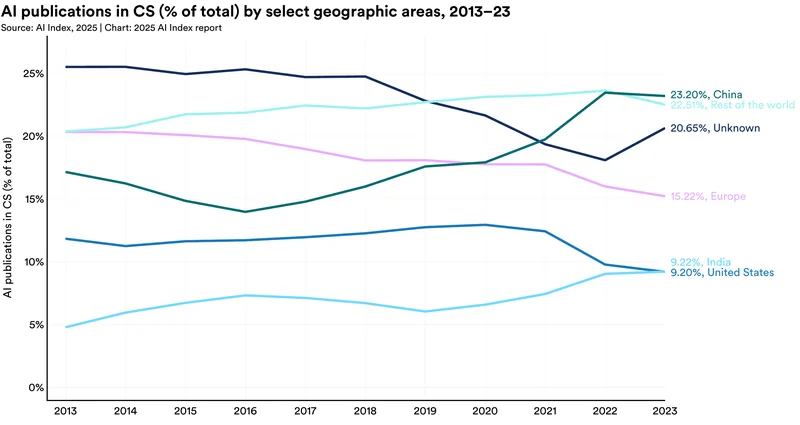
Zooming in on national research output quantity, the report confirms China’s established lead: “‘In 2023, China was the global leader in AI article publications, accounting for 23.2% of the total, compared to 15.2% from Europe and 9.2% from [the United States].’ (Page 35).” Since surpassing other regions around 2016-2017, China has maintained its top position in the sheer volume of AI papers published, though as noted earlier, the U.S. currently leads in producing the most-cited research.
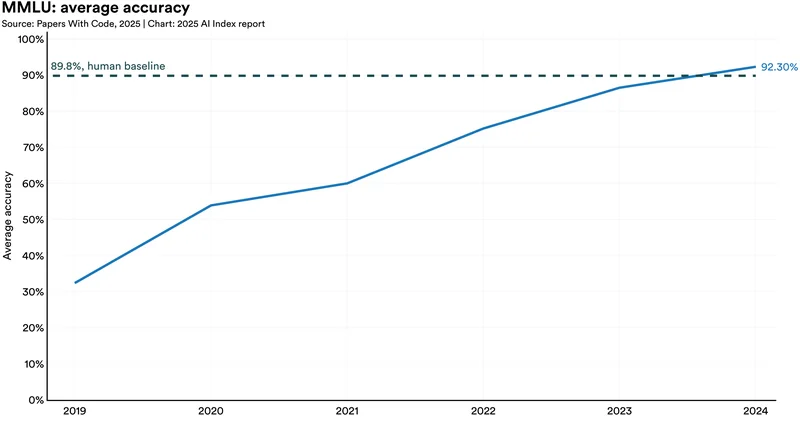
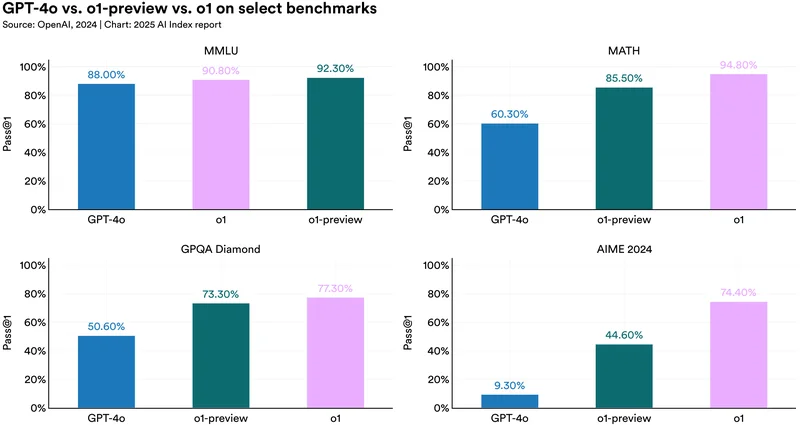
8. Performance gap between US and Chinese models nearly vanishes
Perhaps one of the most significant competitive dynamics revealed is the rapid convergence at the performance frontier: “‘The gap closes between Chinese and U.S. models… At the end of 2023, performance gaps on benchmarks such as MMLU… and HumanEval were 17.5… and 31.6 percentage points… By the end of 2024, these margins had narrowed substantially to 0.3… and 3.7 percentage points.’ (Page 15, Highlight 3).” This near-parity signals intensified global competition and suggests Chinese models are rapidly achieving capabilities comparable to their top US counterparts.
9. ImageNet accuracy reaches 91.5%, but progress slows
AI systems continue to master core visual tasks. Performance on the foundational ImageNet benchmark hit 91.5% top-1 accuracy in late 2024 (Figure 2.2.7). The report, however, cautions that the rate of improvement on such established benchmarks has decelerated compared to previous years. That finding potentially indicates that these specific tests are nearing saturation and may no longer effectively differentiate frontier model capabilities.
10. Object detection (COCO benchmark) scores continue steady climb
AI’s ability to precisely identify and locate objects within complex scenes keeps advancing. Performance on the COCO benchmark reached a mean Average Precision (mAP) of 67.4% in 2024 (Figure 2.2.4). This steady climb signifies ongoing algorithmic refinement in object detection. Those capabilities are key for applications ranging from autonomous systems to medical image analysis, even as progress ramp flattens.
11. Data confirms scaling laws: More compute yields better performance

The report’s data consistently validates the scaling hypothesis central to modern AI development (See Figure 1.3.16, Page 58). Models trained with significantly more computational resources (petaFLOP) generally achieve higher performance across benchmarks. This trend, especially pronounced for LLMs, confirms that greater investment in training compute, coupled with larger datasets, remains a primary driver of capability improvements at the frontier, even as the resource requirements become astronomical. One notable example of this is Grok 3, a model trained using approximately 200,000 Nvidia H100 GPUs, representing a tenfold increase in compute over its predecessor, Grok 2. The compute led to significant improvement gains, exemplifying the scaling hypothesis in action. That is, allocating more computational power and data to model training continues to yield significant gains in AI performance.
12. US dominates global private AI investment, attracting $109B in 2024
While China is catching up on the performance front, the financial engine of AI development remains overwhelmingly U.S.-centric. “‘The U.S. widens its lead in global AI private investment. U.S. private AI investment hit $109.1 billion in 2024, nearly 12 times higher than China’s $9.3 billion and 24 times the U.K.’s $4.5 billion.’ (Page 18, Highlight 3).” Generative AI was a major focus, attracting $33.9 billion globally in 2024 – an 18.7% increase from 2023 and over 8.5 times the 2022 level, representing over 20% of all AI private investment.
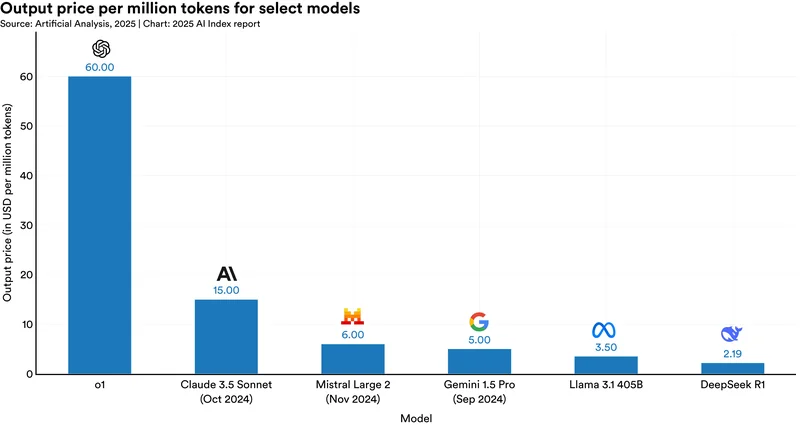
13. AI inference costs plummet over 280-fold in 18 months
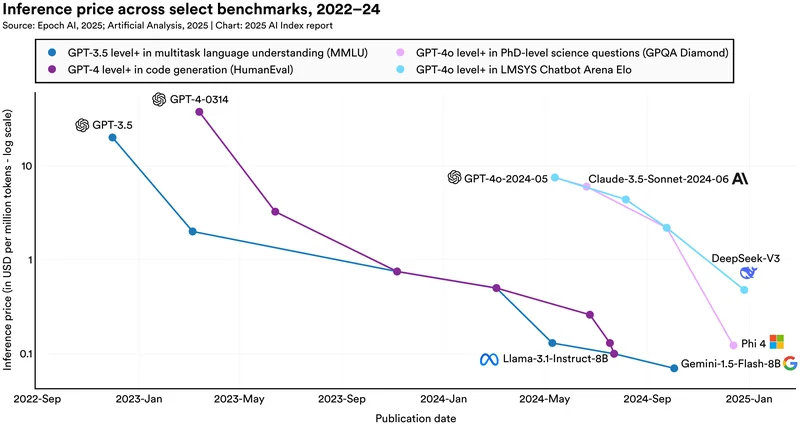
The cost of using capable AI models has decreased dramatically. The report quantifies this with a striking example: “‘The cost of querying an AI model that scores the equivalent of GPT-3.5 (64.8) on MMLU… dropped from $20.00 per million tokens in November 2022 to just $0.07 per million tokens by October 2024… —a more than 280-fold reduction in approximately 18 months.’ (Page 29, Highlight 6).”
14. Training compute for frontier models doubles every five months
The computational appetite for training state-of-the-art AI continues its exponential ascent. “‘New research finds that the training compute for notable AI models doubles approximately every five months…’ (Page 28, Highlight 5).” This swift growth rate, far outpacing Moore’s Law.
15. Hardware energy efficiency improves 40% annually
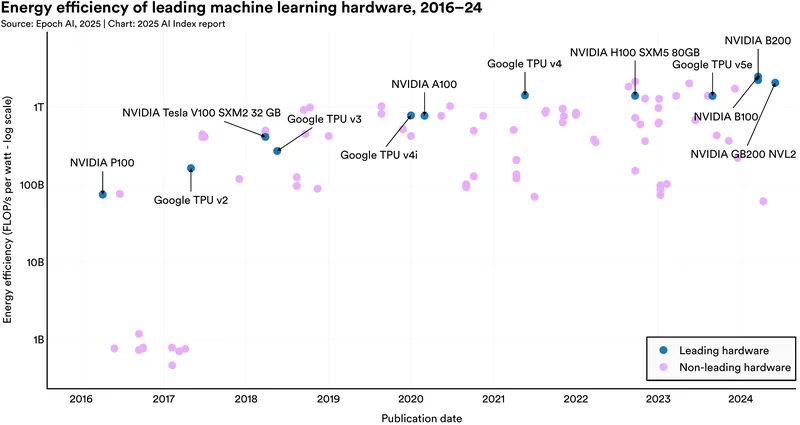
Amidst soaring compute demands, a counter-trend is the significant improvement in hardware energy efficiency. The report finds that ‘…energy efficiency has increased by 40% annually.’ (Page 29, Highlight 8).” For perspective, the Nvidia B100 (released March 2024) offers roughly 33.8 times the energy efficiency (16-bit FLOP/s per Watt) compared to the P100 (released April 2016) (Page 72).
16. Inference cost reductions show huge task-dependent variation
The dramatic fall in inference costs isn’t uniform across applications. “‘Depending on the task, LLM inference prices have fallen anywhere from 9 to 900 times per year.’ (Page 29, Highlight 6).” This wide variance underscores that efficiency gains are highly dependent on the specific AI task and the models optimized for it.
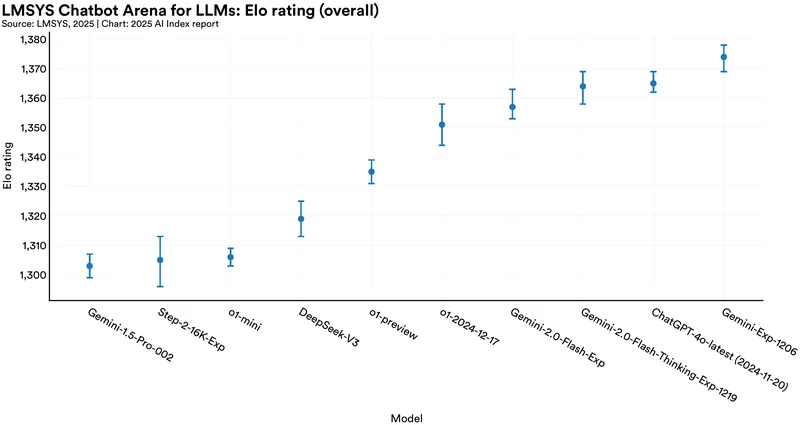
17. Open-weight models achieve near-parity with closed-weight leaders

The performance gap between leading proprietary (closed-weight) and open-weight models has collapsed. “‘Last year’s AI Index revealed that leading open-weight models lagged significantly… By 2024, this gap had nearly disappeared… By February 2025, this gap had narrowed to 1.7%.’ (Page 14, Highlight 2).” Judging by human preference on Chatbot Arena, this near-parity demonstrates the increasing strength and viability of open approaches in achieving state-of-the-art results.
18. Hardware price-performance improves 30% annually
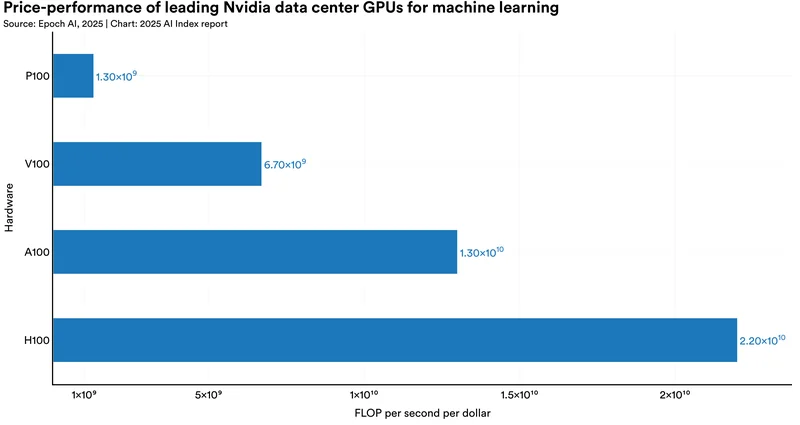
The cost of AI computing power is consistently falling relative to its capability. “‘Price performance has improved, with costs dropping 30% per year…’ (Page 29, Highlight 8).” This means that for a fixed budget, R&D teams can access progressively more powerful hardware over time, further fueling AI development and deployment by making computation more financially accessible.
19. Speech recognition approaches human-level accuracy in benchmarks
AI’s ability to transcribe human speech accurately continues to advance. On the LibriSpeech benchmark’s challenging test-clean subset, the Word Error Rate (WER) dropped to just 1.3% by late 2024 (Figure 2.2.14). This level of accuracy, nearing human performance even in less-than-ideal audio conditions, enables increasingly reliable and sophisticated voice-based interfaces and applications.
20. Llama 3.1 (405B) training emissions dwarf GPT-4’s, nearing 9,000 tons CO2e
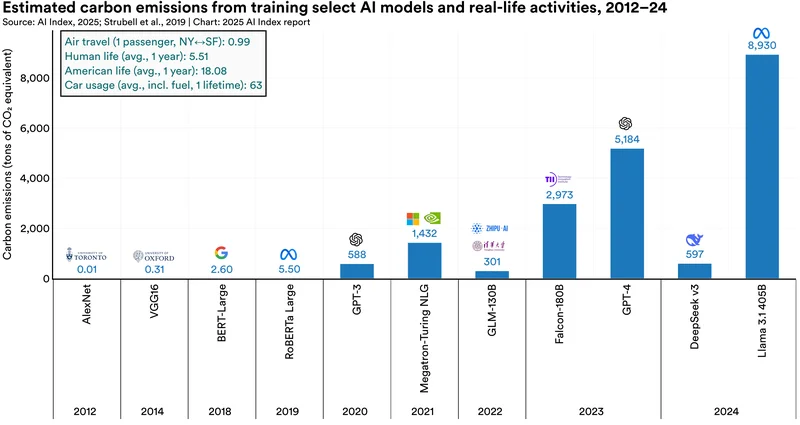
The environmental footprint of training frontier models is escalating dramatically. As the report highlights: “‘Carbon emissions from AI training are steadily increasing… GPT-3 (2020) at 588 tons, GPT-4 (2023) at 5,184 tons, and Llama 3.1 405B (2024) at 8,930 tons. For perspective, the average American emits 18 tons of carbon per year.’ (Page 29, Highlight 9).” Training Meta’s largest Llama 3.1 model generated roughly 72% more emissions than training GPT-4 and is equivalent to the annual emissions of nearly 500 average Americans.
Source and citation for the HAI 2025 AI Index Report:
Nestor Maslej, Loredana Fattorini, Raymond Perrault, Yolanda Gil, Vanessa Parli, Njenga Kariuki, Emily Capstick, Anka Reuel, Erik Brynjolfsson, John Etchemendy, Katrina Ligett, Terah Lyons, James Manyika, Juan Carlos Niebles, Yoav Shoham, Russell Wald, Tobi Walsh, Armin Hamrah, Lapo Santarlasci, Julia Betts Lotufo, Alexandra Rome, Andrew Shi, Sukrut Oak. “The AI Index 2025 Annual Report,” AI Index Steering Committee, Institute for Human-Centered AI, Stanford University, Stanford, CA, April 2025. The AI Index 2025 Annual Report by Stanford University is licensed under Attribution-NoDerivatives 4.0 International. Available at: https://aiindex.stanford.edu/report/