Controlled Environments has once again surveyed its readers to find out what’s trending in the cleanroom business, and which industries are represented by our readership. We also asked questions about industry salaries, workloads, benefits, and job satisfaction.
Cleanrooms are used in various fields
Our first survey question asked readers about the primary field of work performed in their facilities. Tied for the top spot were Pharmaceuticals and Biotechnology/Bioscience/Biologicals/Biomedical, with 15.1 percent each. The next-highest field represented was another tie, between Medical Device/Instrumentation/Electronics and Academic/Research with 12.3 percent each. Last year’s highest-represented field, Clean Manufacturing, was only represented by a little under 5 percent of survey takers in 2018. Other fields represented in the survey were Food and Beverage, Nanotechnology, Nutraceuticals, Packaging, and Semiconductors.
“Other” responses made up a whopping 26.4 percent … the open-ended answers included responses such as Automotive, Veterinary Medicine, Manufacturing for Oilfield Production, and Engineering Solutions for Live Industries.
Choosing equipment and suppliers
Once again, readers were asked about their facility’s foremost concern when purchasing equipment and supplies. For the past three years, the main concern has been the longevity and quality of products. This response garnered 49.5 percent of responses in 2018, up from 2017’s figure of 44.9 percent. Cost was the next highest concern, at 23.8 percent. Getting the newest, most up-to-date models available climbed slightly to 8.6 percent, up from 7.5 percent in 2017. Survey takers concerned about purchasing environmentally friendly products jumped to 14.3 percent, up from 6.1 percent in 2017. Purchasing ethical or American-made products was once again an infrequent concern at 3.8 percent, albeit higher than just 2 percent in 2017.
We queried our readers about their foremost concern when choosing a supplier/distributor for equipment and supplies. Cost once again took the top spot at 24 percent. Concern for a supplier or distributor’s
reputation and reviews came in at 23.1 percent, the same as last year. Desire for a wide selection of products and services was chosen by 20.1 percent of survey takers. Next was a sense of loyalty to the same company, chosen by 15 percent of responders. Environmentally conscious practices and materials was selected by 14.4 percent of responders. Again, not many expressed a desire to purchase from suppliers who provide only American-made products — this figure was the lowest at 2.9 percent.
69.9% of readers plan to purchase cleanroom attire this year, while 55.3% of readers plan to purchase cleanroom monitoring/instrumentation systems this year.
Shopping lists
Responders were given a list of cleanroom supplies and asked to select everything that their facility purchases. Attire once again took the top spot this year, with 69.9 percent of responders saying they plan to purchase. Consumables followed closed behind, at 65.1 percent. Monitoring/instrumentation systems stayed fairly steady compared to last year at 55.3 percent, followed by critical cleaning products at 52.4 percent. Also represented was furniture at 48.5 percent, and both benches/enclosures and cleanroom services (outside cleaning companies, consultants, designers/engineers, etc.) at 43.7 percent each . Half of responders — 50.5 percent —use single-use, disposable cleanroom attire, which is up 10 percentage points from last year’s 40.8 percent. Washable attire use fell to 31.1 percent. The biggest change was represented by single-use, recyclable attire, which was used by 31.1 percent compared to just 7.5 percent of survey responders in 2017.
Your turn to clean up
We asked readers who takes care of cleaning their facility. Most readers — 42.7 percent — said that the cleanroom workers themselves perform cleaning duties, which is up from 36.1 percent in 2017. Meanwhile, 30.1 percent say that they have an in-house staff solely dedicated to cleaning duties, up from 27.8 percent last year. An outside cleaning company is hired by 27.2 percent of survey takers, up from 36.1 percent in 2017. We asked our survey takers how often they have their cleanroom facility inspected by an outside ompany. Nearly half of responders — 49.5 percent — have the facility inspected by an outside company once a year. “More than once a year” was represented by 21.7 percent, and 18.6 percent have their facility inspected by an outside company every two to five years. The percentage of responders who say that they only bring in an outside inspector every five to 10 years was 10.3 percent.
Working 9 to 5
The trend of increasing workloads continued into 2018, with 73.3 percent of responders saying that the demands of their jobs have increased within the past year. Workloads remained steady for 18.6 of responders, and just 8.1 percent said that their job demands have decreased in the past year. Like last year, most survey takers reported getting some kind of increase in pay or benefits in the past year, be it a performance-based raise, a cost-of-living raise, or a stronger benefits package. A little over a quarter of responders said they did not receive any kind of salary increase whatsoever. In a separate question, 70.9 percent said they have not faced any salary or benefits cuts in the past year, which is down from 84.6 percent in 2017. When asked if their company offers adequate opportunities for growth, 48.2 percent said yes, which was down from 53.8 percent in 2017; 32.9 percent said no, up from 30.3 percent last year; and 18.8 percent said they weren’t sure, which is close to 16 percent who said the same in last year’s survey.
Time to move on?
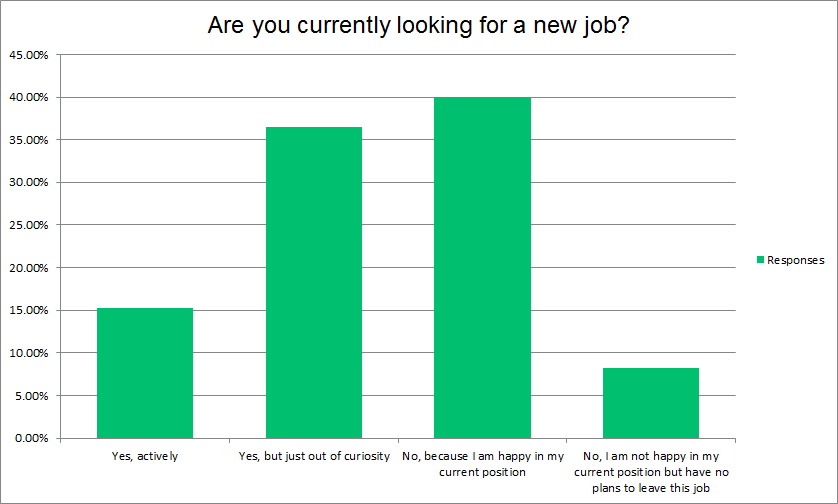
We introduced a new set of questions in the 2018 survey, asking readers if they are looking for new jobs and why. We asked our survey takers if they are currently looking for employment — 40 percent said that they are happy in their current position and are therefore not seeking work; 36.5 percent said that they’re looking simply out of curiosity; 15.3 percent responded that they are actively seeking a new job; and 8.2 percent said that while they’re unhappy in their current position they are not looking to switch jobs at the moment.
For those who responded that they are looking for a new job, we asked them why. Unhappiness with their current salary/benefits package was cited by 27.6 percent of survey takers. A better commute/more flexible hours was desired by 14.5 percent of responders. Another 9.2 percent said that they are bored and looking for a change, while 6.6 percent said that they are unhappy with their current management/coworkers.
References
• 2015 Cleanroom Trends and Salary Survey: https://bit.ly/2tyNVaN
• 2016 Cleanroom Trends and Salary Survey: https://bit.ly/2yO27lj
• 2017 Cleanroom Trends and Salary Survey: https://bit.ly/2KbJDAw
MaryBeth DiDonna is Editor of Controlled Environments. [email protected]; Twitter @cemagazineus