When it comes to selecting a new, long-term cleaning process, pity the poor production engineer. They are always expected to clean more with less.
Regulators are imposing new air quality regulations (fewer VOCs); new shipping, handling, and storage regulations (fewer hazmats); and new waste treatment rules (fewer dead fish). In some locations, a lack of water or rising energy costs are huge problems (less again). These conflicting demands severely restrict a company’s cleaning options.
Despite all the problems, a production engineer needs a cleaning process that is fast, safe, sustainable, versatile, and affordable. While this is a challenging objective, there is a procedure engineers can use to select the optimal solution between these conflicting demands. Here at MicroCare, we call it a “cleaning scorecard.” But first, a word of caution!
The cleaning scorecard
When people talk about football, baseball, or golf, the score pretty much says it all. The same is true with cleaning. But you have to pick the correct score.
Most people believe the cleaning game begins and ends with the cost of a machine or a drum of solvent. They think the lowest priced machine or the lowest “cost per liter” is the best choice. This is completely wrong. In most instances, those two costs are (almost) completely irrelevant. There are many other factors far more important than the cost of the “juice” and the “box.”
Consider your automobile. Everybody understands that fuel economy requires a numerator (miles) and a denominator (gallons). Miles/gallon is the fundamental index to measure the fuel-efficiency of the car, just as miles/hour measures speed, watts/amp is the way to track voltage, and units/day is an index of productivity.
Smart engineers need a score or a cleaning index to measure the economics of cleaning. In my experience, the best cleaning index is total cost per part cleaned. This focuses everything on one, paramount question: how can we clean the product at the lowest total cost?
So here’s your sound bite: stop caring about just the solvent cost. It’s not the cost-per-liter that really matters, it’s the total-cost-per-part-cleaned. That’s where your profits will be made or lost.
I’m glad we cleared that up. Now, here are some numbers to put on your cleaning scorecard.
Take a practice swing
When you buy a golf club, you need one that fits your swing. Similarly, cleaning machines come in all different sizes. But don’t grab the tape-measure yet—the size of a cleaning machine isn’t measured in inches. The best fit is measured in production capacity or cleaning capacity. And just like a new golf club, car, or suit, you have to select the machine that fits best.
The “cleaning fit” can be measured several ways. The least precise (but often adequate) method is to measure the number of units which have to be cleaned: 300 boards per day, 500 pieces per week, and so on. Another option is to estimate the total surface area of all the parts to be cleaned. This is most useful when there are a large variety of parts with many different shapes. Keep an eye on the extremes: very small or very fragile components may have different cleaning requirements than larger pieces.
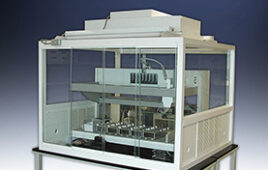
Now that you have defined the capacity you need, you can evaluate which type of cleaning technology is best for your situation. For example, benchtop cleaning machines are slow, but small and cheap. High-volume systems are larger, more capable, usually more efficient and always more expensive. Consider all your options.
Then, take the systems which appear to have the best fit-out for a test drive. Prepare a batch of typical products and have each manufacturer run them through their cleaning systems. The manufacturer should be able to produce a brief written report that describes the process, solvents, temperatures, times, and results. Be sure the systems perform to your standards. Do this testing first, because this is the easiest part of the selection process.
Now comes the hard part: computing which system produces clean parts at the lowest total cost. A list of the major costs is included with this article, but each project may require other items be added to the list.
On the first tee: Computing throughput
When comparing different cleaning technologies, engineers need to estimate the average productivity of the system in terms of assemblies per hour. This is crucial to computing the cost-per-part-cleaned because operational and labor expenses usually are tabulated as hourly costs.
Start with the cycle time. This is defined as the duration of one complete cleaning cycle, including loading and unloading. A machine that cleans twenty boards simultaneously in a forty minute cleaning cycle has a throughput of one board every two minutes, or an average throughput of thirty boards/hour. Your vendors should be able to provide benchmark numbers.
Many factors affect throughput. For example, loading and unloading a machine is part of the cycle. Water-based machines often cycle quickly when cleaning large, simple shapes; vapour systems are faster when cleaning tight spaces and components with many voids.
Throughput affects operating expenses dramatically. For example, DuPont reports that in a small, modern vapor degreaser “normal” solvent losses are about 0.118 lbs. per square foot of vapor area per hour of operation, or roughly one pound per day (larger and more efficient machines have still lower loss rates). In stand-by mode, this drops 75%. To compute total cleaning costs, engineers will need a fairly accurate estimate of the throughput requirements placed on the systems.
The front nine: One-time costs
To calculate and compare total cleaning costs, all of the costs for each system need to be re-calibrated into one standard unit of measure, the total cost per part cleaned. That’s easy to track for consumables like solvent and electricity, but often the initial acquisition costs are ignored (refer to the checklist for other fixed costs to consider).
Up-front capital costs include the actual cost of the machine, freight, site preparation and set-up costs. Most engineers also include building renovations, ventilation enhancements, electrical upgrades and water-treatment subsystems required to support the new system. These expenses can be as costly as the cleaning machine itself, so be sure to include your facilities manager, your health and safety people, your environmental people and your fire safety team as well as the production people in developing these plans.
Engineers should include the cost of the funds that will be tied up in the machinery. With a spreadsheet, it’s easy to use the “payment” (PMT) financial function to estimate the cost-per-month of the equipment, which can easily be converted into a cost-per-part.
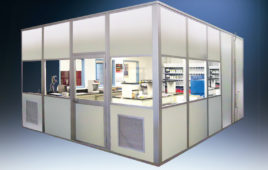
Another consideration is the actual cost of the space required by the cleaning machine and the support systems it requires. The “floor space requirement” usually is described as a multiple of the physical size of the machine.
It has been my experience that aqueous and semi-aqueous systems require more floor space than solvent-based systems. Aqueous systems require water-treatment facilities which can be as large as the cleaners themselves. Aqueous systems also have slower cycle times, so more space is needed for work-in-progress, supplies, conveyor systems and access aisles.
For example, I have seen a 30-foot aqueous cleaner which had a 200 sq. ft. footprint in the factory. But the system tied-up 1,400 square feet of floor space with ancillary systems: a 7X floor space factor. For vapor systems, a 4X factor would be a reasonable rule-of-thumb.
To estimate floor space costs, call your financial people and ask them for the “fully-loaded per-foot costs” for the space in which you are interested. This usually will be expressed as a triple-net rent per square foot. Included this number should be the cost of the space itself, plus heating, cooling and lighting costs, and some portion of the cost of shared facilities, like the lavatories.
The back nine: Operating costs
Once the throughput has been defined, it is relatively easy to compute operating costs. Normally the equipment manufacturers will provide rule of thumb guidelines for typical installations. Direct operating costs include the cost of lost solvent, the cost of the electricity and the cost of consumables (e.g., saponifiers, filters, etc.) which are required by the system.
‘Drag-out’ is a special operating cost, and this is one of the few areas where the cost of the solvent comes into play. Drag-out is the loss of solvent due to being trapped in, on and around the clean parts as they move through the cleaning system. High-boiling solvents like water and hydrocarbons are prone to high drag-out losses but the chemicals are relatively cheap. Low-boiling solvents can minimise drag-out but—since these solvents are pricey—even small losses can be alarmingly expensive.
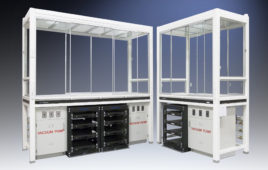
Look for optional equipment which helps eliminate drag-out losses. Newer vapor degreasers use extra refrigeration, superheat and hoists to reduce drag-out losses and save money. Aqueous systems have similar money-saving options such as air-knives and extra drying chambers which cut solvent losses but add to the electric bill. It’s sad but true: there is no free lunch.
A good vendor should be able to document incremental operating costs and drag-out losses on a feature-by-feature basis. Furthermore, they should be able to highlight specific environments (e.g., types of contamination, cycle times) which optimize the usefulness of each feature. With this data, it becomes simple for a savvy engineer to add these costs to the cleaning scorecard.
Labor costs
Labor is the dirty secret of cleaning and should be handled separately from the other operating costs. Many companies feel their automated cleaning processes are under control. But inspection reveals they often have technicians performing auxiliary inspections, hand-spraying, re-cleaning, and drying the products outside of the machine. In today’s world, manual intervention should be rare. If it is not, something is wrong.
Recently, I inspected an old aqueous system that originally had been designed for through-hole boards. Originally the system had been fast and efficient but now it was cleaning BGA circuits. The cleaning cycle had slowed almost 50%. Technicians spent extra ten minutes on each board manually drying them with compressed air. This inexpensive but inflexible cleaning system had suddenly become a very expensive choice.
To price out your labor costs, obtain the “fully-loaded labor rate” for the technicians who will operate the machine (this number will be at least two to three times the actual take home pay). Remember to include the value of the engineer’s time, making sure the solvents remain within specs and the waste treatment systems are operating correctly. Also include the cost of training, the costs of the maintenance techs, and any chemical safety training. If turnover is a problem, add additional funds for quarterly supplemental training.
Maintenance
Big machines have complex maintenance problems, and aqueous systems have the most complexities. In part, this is due to the size of the systems (30 feet long is not unusual) and the number of moving parts. They also have complex water treatment and recycling processes which must be maintained and sustained for the life of the machine. Another complexity is the alkaline additives used to boost the cleaning power of many systems; these additives coat the machine’s interior and can cause additional maintenance problems.
But vapor systems are not maintenance-free. Filters need to be checked and replaced. From time to time, the solvent in the degreaser needs to be boiled down and the sludge at the bottom of the system removed. This usually results in the loss and disposal of approximately 10% of the solvent in the machine on a quarterly basis.
In the rough: Indirect costs
In today’s litigious environment, there are no issues more crucial than health, safety and environmental protection. The diligent engineer must dig through the hype to get the real facts.
For example, everyone agrees that n-propyl bromide (nPB) is a great cleaner. But the product has significant toxicity issues, so the chemical has to be handled in a sophisticated manner, with modern, “tight” degreasing equipment. An old, leaky open-top degreaser will expose employees to dangerous levels of the solvent and is simply no longer acceptable. This situation imposes certain costs on users which may make the cleaner an unattractive choice; that’s for each company to decide. But you must dig, and research, and question again and again to get the real facts.
Environmental issues also will shape your choices. In California, tight VOC regulations suggest that water cleaning might be optimal. But the high cost of water and electricity may make that choice unaffordable today, and one of the major contributors to global warming is the burning of fossil fuels to generate electricity. Energy efficiency is not only good for the purse, it’s good for the planet.
Planning for the future is also difficult. For example, in the 1990s the electronics industry migrated from vapor cleaning to aqueous technologies and enjoyed years of success cleaning their through-hole and SMT designs. But now ultra-dense BGA boards are the norm. As a result, many electronics manufacturers now are swinging back to vapor degreasing which easily cleans dense designs with less electricity and without water.
So some plucky engineer needs to grab the old crystal ball and search for a cleaning technology which will not become prematurely obsolete. A best question is “What assumption am I making today which could derail this technology tomorrow?” Finding the weakest assumption is the toughest job for engineers today.
The 19th hole
As we have seen, there are many factors to tabulate when selecting a new cleaning system. The first recommendation is always to try to pass the job to somebody else. Failing that, use the following cleaning scorecard:
a. Determine the likely cleaning requirements for today’s products as well as those of tomorrow. Average those requirements into a daily or hourly rate of required throughput.
b. Compare different cleaning technologies. Send samples to the equipment makers to prove the ability of their systems to clean the components to your specifications. Winnow out the systems that can’t do the job.
c. From among the surviving candidates, collect comparative data on every important characteristic. Be sure to examine up-front capital costs, floor space costs, installation costs, energy costs, water costs, solvent costs, labor costs and maintenance costs.
d. Convert all of the cost data into a performance index. The industry’s most popular index is total cost per part cleaned.
e. Select the option which minimizes total cost per part cleaned.
Using standard statistical tools, engineers can model all the operating costs for systems of different types and sizes. If this process is completed accurately, thoroughly and impartially, the savvy engineer can be confident that the selected system will become a valued part of the production process for years to come.
Checklist of Cleaning Costs
One-Time Capital Costs
• Cost of Cleaning System
• Freight and Insurance
• Site Engineering and Architectural Planning
• Costs
• Construction
• Electrical Changes
• Water/Plumbing
• Ventilation
• System Set-Up
• Cost of Capital
Floorspace
• Actual Footprint or Size of Machine
• Work Space Multiplier
• Cost Per Square Foot
Throughput Calibration Factors
• Cycle Time
• Boards Per Cycle
• Max. Boards/Hr.
• Required Operating Hours/Day
• Stand-by Hours/Day (normally much lower costs/hour)
Operating Costs
• Labor: Operator, Cost Per Hour
• Labor: Inspection & Recleaning, Cost Per Hour
• Labor: System Maintenance, Cost Per Hour
• Electricity
• Water
• Consumables (Filters, etc.)
• Solvent Losses (Drag-Out)
• Solvent Disposal
Mike Jones is Vice President of MicroCare Corp., a benchtop cleaning company based in New Britain, Conn. He can be reached at [email protected].
This article appeared in the September 2014 issue of Controlled Environments.