 Amanda Randles, director of Duke University’s Center for Computational and Digital Health Innovation, simulates blood flow at the level of individual red blood cells, sometimes hundreds of millions of them across simulations spanning roughly 700,000 heartbeats. The data volumes are so large that results have to be visualized while still in the memory of a supercomputer, because writing everything to disk would be too slow. That scale is helping close a gap in clinical measurement. In current cardiology practice, clinicians rely on intermittent snapshots: an imaging scan here, a reading during a clinic visit there. Such snapshots do not capture the continuous dynamics of cardiovascular disease, which can evolve over months or years. Randles, whose work earned her the 2023 ACM Prize in Computing and a 2022 NIH Director’s Pioneer Award, wants to build personalized digital twins that integrate data over time, enabling individualized risk prediction early enough to guide intervention.
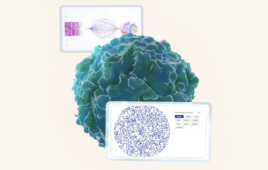
Making results visible and usable at that scale is another challenge. Her group works closely with visualization experts at organizations such as Argonne National Laboratory and Oak Ridge National Laboratory, and one of her trainees has built an entire dissertation around what Randles calls “in situ visualization, meaning how you visualize data while it’s still in memory on the supercomputer.”
The simulations can generate petabytes of data, and there is no practical way to export and explore that volume after the fact. A single rendered image of streamlines through a patient’s coronary artery, she said, required several programs to process and render. At the red-blood-cell scale, the challenge is greater with the aim of deciding what to highlight so the signal of disease does not disappear inside the data. “Most people don’t pick up on how difficult that is,” Randles said.
A lot of what we’ve been doing is trying to figure out how you learn about the cells. How do you convey that information in a way that is useful?
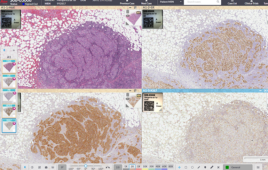
The lab has pushed into territory that questions the notion of computational fluid dynamics as purely a math-and-code discipline: user studies. Randles’s team is running head-to-head comparisons of immersive displays: Apple Vision Pro, Sony’s Spatial Reality Display (ELF-SR2, a glasses-free 3D screen), stereoscopic systems, and conventional 2D monitors. Such technology can help test when spatial visualization helps clinicians spot regions of concern faster and more accurately. The bar, she said, is simple: it has to be “useful.” In the last couple of years, higher-resolution displays and lower-friction setups have started to shift the answer. Earlier head-mounted systems took too long to set up between patients or in the operating room. Sony’s glasses-free display, in particular, has opened new possibilities. “There are no glasses, but it still gives you that 3D interaction,” Randles said. “They can use that more easily, even in the OR,” including when clinicians have gloves on or other equipment that rules out a headset.
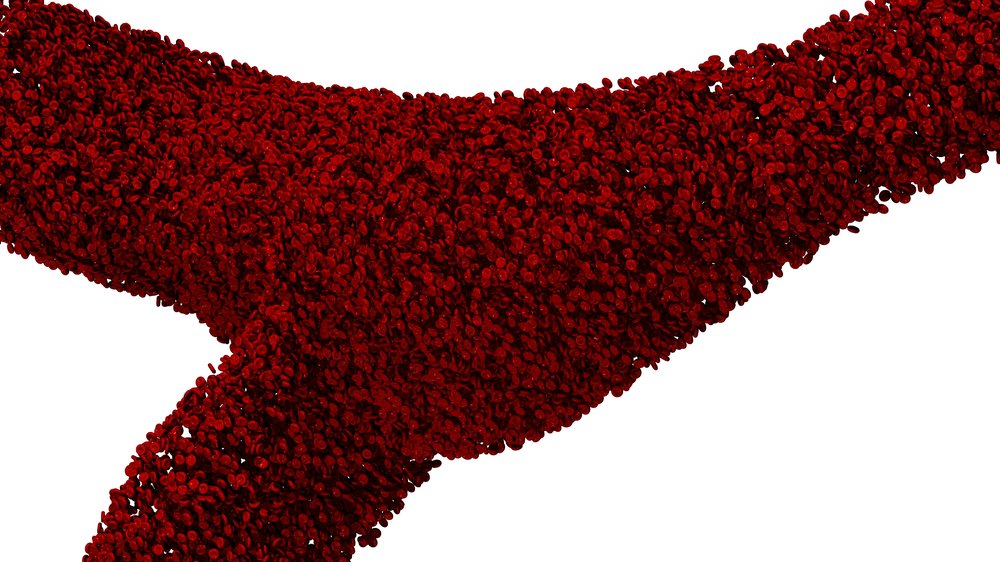
Individually modeled red blood cells flow through a branching artery in a HARVEY simulation. (Image credit: Randles Lab / Duke University)
The clinical response has, at times, surprised her. In physician user studies, sessions routinely run long because the participants are engaged. “The attendees spend hours with us and won’t leave,” Randles said. Pediatric cardiologists, in particular, have been quick to engage. An infant’s heart can be roughly the size of a walnut, for instance. Any tool that lets a surgeon enlarge it, rotate it, and see simulated blood flow before an intervention can translate directly into planning confidence. Randles has also seen patient traction: 3D views can make structural heart disease intuitive for families who otherwise struggle to understand what a diagnosis means, or why a specific treatment is being proposed.
Outside of redefining visualization, another goal is making the underlying simulation fast and portable enough to use outside a national lab. Randles frames this as two distinct modes of work. In the first, her team does not yet know which biomarker matters, so the simulations have to capture everything: every red blood cell, every hemodynamic variable, across long stretches of simulated time. “We’ve never been able to track 3D blood flow over long periods of time,” she said, “so we can’t tell you, you know, if the vorticity in your LAD [left anterior descending artery] changes slightly a week ahead of time, you’re going to have symptoms of heart disease in two weeks. We don’t know what that marker is we’re looking for.” That discovery phase is computationally enormous, requiring petabytes of stored data and sustained runs on top-tier supercomputers.
But when the biomarker is already established, the computational cost drops significantly. Pulmonary artery pressure, for instance, is an early indicator of worsening heart failure, and Randles’s lab can target it directly. “For heart failure, we know that the pressure in the pulmonary artery is predictive of downstream” decompensation, she said. “So we can build an AI surrogate, or we can use even a one-dimensional reduced-order model.” Some of those stripped-down models, she noted, could run on a phone, taking input directly from a wearable. The full-fidelity simulation is the teacher; the surrogate is the student, trained to answer a narrower question at a fraction of the cost.

Simulated red blood cells rendered at subcellular resolution. (Image credit: Randles Lab / Duke University)
That narrower question is already being tested in a concrete clinical workflow. In a carotid artery study, every enrolled patient wears a Fitbit. The lab collects CT scans to map the geometry of each patient’s carotid, then runs blood flow simulations driven by the heart rate data from the wearable. To validate the output, clinicians perform Doppler ultrasound on the carotid, directly measuring velocity flow profiles that the simulation is trying to predict. “We’re getting a Doppler ultrasound on the carotid to actually directly measure the velocity flow profiles that we’re using to then compare and see, are we getting the accurate flow?” Randles said. The study is also probing sensitivity: how accurate does the wearable need to be, at rest versus during exercise, for the simulation to produce clinically useful results?
The larger ambition behind studies like that is a shift in what simulation is for. Companies like HeartFlow have already demonstrated that computational models can inform consequential clinical decisions. HeartFlow’s FFR-CT (FFRct) analysis, for instance, derives a fractional flow reserve measurement from coronary CT angiography, helping clinicians assess whether a stenosis is flow-limiting and inform management decisions, including whether a patient may benefit from stenting. Randles wants to push beyond that single time point. “What we’re trying to do is push it to look at longitudinal monitoring, and can we watch these patients over time and give feedback?” she said. “Could that enable early diagnosis and find those patients before they start seeing decompensation for heart failure, or before their symptoms really arise?” The idea is that a digital twin, updated continuously from wearable data, could detect a drift in a patient’s personalized baseline long before it becomes a symptom. “Your baseline might be different than my baseline,” she said. “The shift in your baseline is going to be more predictive” than any single measurement or population-level average.
Amanda Randles is the Alfred Winborne and Victoria Stover Mordecai Associate Professor of Biomedical Engineering at Duke University’s Pratt School of Engineering. She holds the 2023 ACM Prize in Computing, the ACM Grace Murray Hopper Award, a 2022 NIH Director’s Pioneer Award, the NSF CAREER Award, and is a Fellow of the National Academy of Inventors. She was named to the MIT Technology Review Innovators Under 35 list, and her project was selected for Argonne’s Aurora Early Science Program (one of 10 data science and machine learning projects in that cohort). She received her PhD in applied physics from Harvard University and her BA in computer science and physics from Duke.