In 2023, Merck & Co. spent more than half of its revenue on R&D. Sure, the figure was inflated thanks to its $10.8 billion acquisition of Prometheus Biosciences, which it budgeted as an R&D cost. But Moderna spent even more as a percentage, $4.85 billion of its $6.85 billion revenue in revenue on R&D while fellow mRNA company BioNTech spent (46.69% in 2023). Even excluding Merck and mRNA companies, pharma companies spend vast sums on R&D compared to their medtech brethren, which tend to have a stable R&D intensity around 9-10%. The percentage spent on R&D is very consistent across companies.
And the delta between pharma and medtech R&D intensity is widening while two of the best-performing pharma firms, Eli Lilly and Novo Nordisk, have seen stock gains despite lower R&D intensity than peers — largely as a result of smart bets on metabolic drugs.
More spending, sometimes less innovation?
But here’s where it gets interesting: The correlation between R&D spending and innovation output paints a picture where less is sometimes more. In 2023, Medtronic, with an R&D intensity of just 8.45%, generated 443 patents and 305 publications. That same year, the company won significant FDA approvals, including its PulseSelect Pulsed Field Ablation (PFA) system, Symplicity Spyral renal denervation device and the MiniMed 780G, the world’s first insulin pump with meal detection capability.
Compare this to Moderna, which despite spending 70.75% of revenue on R&D, produced 27 patents and 245 publications. Regarding FDA approvals, Moderna has secured two primary authorizations: its original COVID-19 vaccine (Spikevax) in January 2022, subsequent COVID-19 variant-specific boosters, and most recently, mRESVIA for RSV in May 2024. Yet the company reported a $1.2 billion net loss in the first quarter of the year. Moderna was also in the top five firms in this analysis of 18 organizations across the life sciences for R&D intensity. The other four were fellow mRNA company BioNTech and then Merck & Co., Lilly, and Roche (which also has non-pharma revenue).
Medtech firms led in granted patents, too
Higher R&D spending doesn’t necessarily translate to more innovation output. Take Medtronic: with less than 9% R&D intensity, it had more than 440 USPTO patents and 300-plus publications in 2023. Conversely, Moderna, despite spending more than 70% of revenue on R&D, generated fewer than 30 patents and 250 publications in the same time frame. Or look at Boston Scientific, spending about 10% of revenue on R&D, produced nearly 300 patents in 2023, while BioNTech, spending close to 47%, filed fewer than 10 patents. Even large traditional pharma companies like Pfizer and AstraZeneca, each spending over 20% on R&D, generated only 50 and 34 patents respectively. The medtech firms anlyzed consistently showed more patent output per R&D dollar invested.
See below for a breakdown for the eighteen total firms in the dataset with Merck being the outlier (round dot) on the left. Pharma companies typically invest 20-40% of revenue in R&D, while medtech firms maintain a much tighter band hovering somewhere around 10%.
Higher R&D spending doesn’t necessarily translate to more innovation output. Take Medtronic: with just 8.45% R&D intensity, it led 2023 patent production with 443 patents and 305 publications. In contrast, Moderna, despite spending 70.75% of revenue on R&D, generated only 27 patents and 245 publications. This pattern extends across sectors – Boston Scientific, spending 9.93% of revenue on R&D, produced 292 patents in 2023, while BioNTech, spending 46.69%, filed just 8 patents. The medtech sector consistently shows stronger patent output per R&D dollar invested.

A tale of two R&D strategies
Moderna’s recently announced $1.1 billion in cost cuts, including R&D reductions after facing pressure from investors to trim costs. The company aims to slash R&D spending from $4.8 billion to the $3.6–3.8 billion range by 2027.
Even at the reduced level, Moderna’s projected R&D spending of $3.6-3.8 billion would represent an R&D intensity that dwarfs the entire medtech sector. For perspective, Medtronic, the largest pure-play medical device company in our analysis, spent $2.735 billion on R&D in 2023 — about 8.45% of its revenue. Intuitive Surgical, with a reputation as one of medtech’s most innovative companies, spent $999 million on R&D (14.02% of revenue) while maintaining its leadership in robotic surgery.

Apples and oranges: Different innovation dynamics
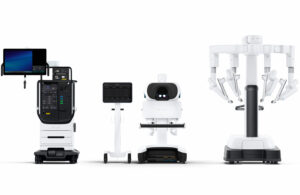
da Vinci 5 surgical robot
Consider Intuitive Surgical’s recent innovation trajectory. The company’s steady R&D investment (14.02% of revenue) yielded results: its da Vinci 5 surgical robot, which FDA cleared in March, offering higher accuracy than its predecessor, new 3D imaging capabilities, and novel force-sensing tech. The system also boasts more than 10,000 times more computing power than its predecessor. And in May, the FDA authorized a labeling update for the da Vinci X and Xi systems specific to radical prostatectomy procedures.
And to be sure, getting FDA approval for drugs is wholly different than getting 510(k) clearance or a PMA for a device. The cost of a successful FDA approval is more than $5 billion if you account for the entire pharma ecosystem and drug candidates that fail to make it to market, as a recent Nature analysis did.
Take another look at innovation efficiency ratios. Boston Scientific, spending 9.93% of revenue on R&D, generated 292 patents in 2023. Meanwhile, BioNTech, spending 46.69% of revenue on R&D, filed just 8 patents. The medtech sector consistently shows higher patent output per R&D dollar invested.
You want more examples? Johnson & Johnson offers a unique window into this dynamic, housing both pharma and medtech divisions under one roof. In 2023, J&J’s pharmaceutical segment spent $11.96 billion on R&D (21.8% of revenue), while its medtech division invested $3.122 billion (10.27% of revenue). The outputs tell an interesting story: While J&J Pharma secured key FDA approvals like Sirturo for tuberculosis and advanced a DARZALEX Faspro-based therapy for multiple myeloma, J&J Medtech matched the innovation pace with FDA nods including the TruDi electromagnetically navigated shaver blade for ENT surgery, MemoryGel BOOST breast implants, and the integration of Abiomed’s FDA-approved Impella heart pump portfolio.

R&D vs. revenue in pharma vs. medtech
Methodology
Patent data was aggregated from the USPTO database via Google BigQuery’s public patent datasets and cross-referenced with IFI CLAIMS Patent Services and other sources. Publication data was collected from scientific databases (SCOPUS and OpenAlex) tracking peer-reviewed literature. All financial metrics, including revenue, R&D expenditure, and R&D intensity calculations, were sourced directly from company annual reports (10-K filings for U.S. companies and annual reports for international firms). Stock performance data was retrieved using the yfinance API. For companies with multiple divisions (like Johnson & Johnson), we separated pharmaceutical and medical device segments based on their reported segment financials.
The analysis included these pure-play pharmaceutical companies: Merck & Co., Eli Lilly, Roche, Novo Nordisk, Moderna, BioNTech, Sanofi, Novartis, GSK, Pfizer, and AstraZeneca. Medical technology companies included were Medtronic, Stryker, Boston Scientific, Intuitive Surgical, and Siemens Healthineers. We also included diversified healthcare companies: Johnson & Johnson and Abbott (with separate analysis of their pharma and medtech divisions). Time period: The core analysis focuses on 2023 data, with historical data from 2019-2022 used for trend analysis. All analysis done in Python using open source tools.