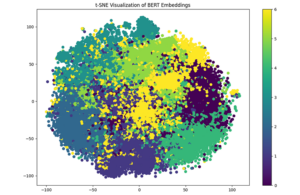
A clustering analysis of embeddings derived from R&D World content. In this diagram, t-SNE (t-distributed Stochastic Neighbor Embedding), a machine learning algorithm used for dimensionality reduction, was used to visualize the high-dimensional dataset.
One of the unsung heroes of the recent explosion in interest in AI — especially in terms of large language models and natural language processing — is the word embedding. Representing a vector of real numbers, embeddings have been around in one or another since for decades. In the 1980s and 1990s, researchers explored a variety of vector space models and dimensionality reduction techniques for representing words.
Here, we’ll be looking at word embeddings in machine learning in particular. These are a subtype of embeddings. In mathematics, a general embedding refers to the way one mathematical structure is contained within another instance. As Wikipedia notes:
When some object X is said to be embedded in another object Y, the embedding is given by some injective and structure-preserving map f: X → Y.
While the term “embedding” wasn’t explicitly used in a groundbreaking 2003 paper titled “A Neural Probabilistic Language Model” from Bengio et al., the paper substantially advanced the concept of word embeddings, paving the way for their widespread adoption later on. The authors describe a method to “associate with each word in the vocabulary a distributed word feature vector (a real-valued vector in ℝm)” that can “express the joint probability function of word sequences in terms of the feature vectors of these words in the sequence” and “learn simultaneously the word feature vectors and the parameters of that probability function.”
This idea continued to gain ground after Tomas Mikolov and colleagues at Google in 2013 introduced Word2Vec, an efficient method for learning high-quality vector representations of words from large amounts of unstructured text data. The publication kickstarted a wave of progress in the field of natural language processing by showing that simple vector arithmetic could capture semantic relationships, famously showing that vector (“King”) – vector(“Man”) + vector(“Woman”) results in a vector very close to vector(“Queen”). (The Word2Vec system would also cause controversy for capturing latent bias as Brian Christian detailed in “The Alignment Problem.”)
The video below offers a clear overview of embeddings in the context of generative pre-trained transformers. The link below skips to the relevant portion, but the whole video is recommended if you have the time:
Embeddings in plain-ish English
But what does embedding mean in plain English? Essentially, this: instead of treating words as isolated units, we can represent them as vectors in a multi-dimensional space — a kind of “word map” where location is everything. Words with similar meanings cluster together, while those with different meanings reside farther apart. Picture embeddings emanating from the origin in all direction in high dimensional space.
The interactive embedding demonstration below shows embeddings for a variety of R&D domains. The embeddings were generated using Bidirectional Encoder Representations from Transformers (BERT), which Google developed circa 2018. The diagram below shows the embeddings in 3-D vector space using Principal Component Analysis (PCA), a technique that can reduce the dimensionality of data while retaining as much of the original variability as possible. In this illustration, the original BERT embeddings (bert-base-uncased) were initially in high-dimensional space (768 dimensions for bert-base-uncased). PCA can reduce the dimensionality by finding the directions (called principal components) along which the data varies the most.
Consider that before word embeddings were popularized, traditional keyword-based search methods were one of the only tools around for finding relevant research papers on graphene. While looking for information on, say, graphene’s potential applications in energy storage, a researcher might use keywords like “graphene battery” or “graphene supercapacitor.”
But such an approach could miss numerous relevant results in the literature that used different expressions. Thus, embeddings allow for semantic search, enabling researchers to find relevant papers even when the exact keywords don’t match. For instance, a search for “graphene in energy storage” could return results about
- “Carbon nanostructures for electrochemical capacitors.”
- “Two-dimensional materials for next-generation batteries.”
- “Atomically thin electrodes for high-performance energy devices.”
For a demonstration involving several seminal embedding examples, including Word2Vec and the MNIST dataset of hand-written digits, check out the this Tensorflow demonstration.
Connecting cross-disciplinary dots
One of the most promising applications of embeddings in research is their ability to uncover non-obvious connections between different fields. A 2022 Nature paper, for instance, explained that researchers have developed embeddings to represent entire academic disciplines based on co-occurrence statistics of field of research (FoR) codes from millions of published articles. The authors report exploring “a dataset of over 21 million articles published in 8400 academic journals between 1990 and 2019” and proposes an embeddings-based strategy to investigate the geometric closeness between the embeddings.
For R&D-intensive industries, embeddings can also help visualize and analyze large patent datasets, identifying white spaces for innovation and potential infringement risks. Korean researchers in IEEE explained that patent embedding-based search was effective in R&D benchmarking.
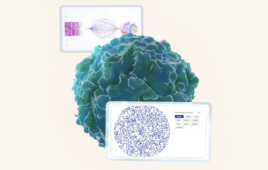
In the example below, we used embeddings to cluster R&D World content into several content themes, including nanotechnology and advanced materials. While the word cloud here itself doesn’t use embeddings, the preceding clustering process did. In the word cloud, words that appear more frequently show up larger.
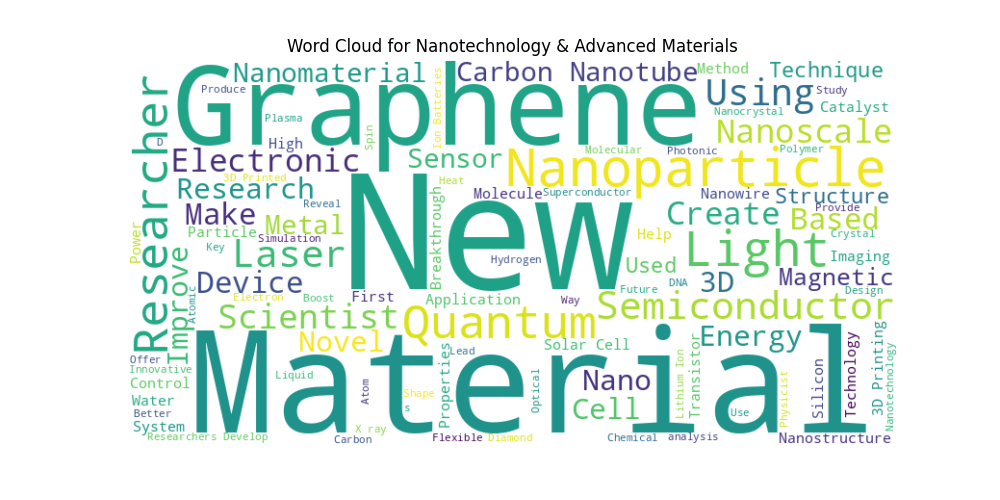
Word cloud example
An embeddings exploration using R&D World content
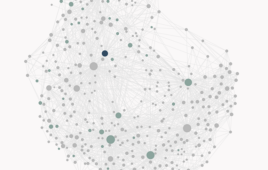
To show how embeddings can be used in R&D content analysis, we applied these techniques to R&D World articles spanning a roughly three year time frame. This data included not only the articles themselves, but also user-defined interactions like search activity. Using BERT embeddings and Principal Component Analysis (PCA), we created an interactive 3D visualization (shown below) of the content ecosystem.
Each point represents an article, its position determined by the semantic similarity of its content to others. The visualization makes use of an unsupervised machine learning approach known as K-Means clustering (which incidentally has some limitations) to highlight thematic areas within R&D World coverage. In the interactive chart below, distances between points reflect the degree of similarity between topics. Colors represent different clusters of articles, grouped using K-means.
By hovering over points, users can see article titles and cluster assignments. The interactive visualization also hopefully inspires some further exploration of novel ways to apply embeddings to your own workflow.