Research & Development World

  • R&D World Home
  • Topics
    • Aerospace
    • Automotive
    • Biotech
    • Careers
    • Chemistry
    • Environment
    • Energy
    • Life Science
    • Material Science
    • R&D Management
    • Physics
  • Technology
    • 3D Printing
    • A.I./Robotics
    • Software
    • Battery Technology
    • Controlled Environments
      • Cleanrooms
      • Graphene
      • Lasers
      • Regulations/Standards
      • Sensors
    • Imaging
    • Nanotechnology
    • Scientific Computing
      • Big Data
      • HPC/Supercomputing
      • Informatics
      • Security
    • Semiconductors
  • R&D Market Pulse
  • R&D 100
    • Call for Nominations: The 2025 R&D 100 Awards
    • R&D 100 Awards Event
    • R&D 100 Submissions
    • Winner Archive
    • Explore the 2024 R&D 100 award winners and finalists
  • Resources
    • Research Reports
    • Digital Issues
    • Educational Assets
    • R&D Index
    • Subscribe
    • Video
    • Webinars
  • Global Funding Forecast
  • Top Labs
  • Advertise
  • SUBSCRIBE

What is hyperspectral image analysis?

By Paul Heney | November 2, 2020


An imaging technique that shows the underlying spectrum for each pixel

Hyperspectral imaging combines digital imaging with spectroscopy, so that the underlying frequencies in the spectrum for each pixel can be identified. Because only a single wavelength can be represented as a colour for a pixel, a two-dimensional hyperspectral image effectively represents three-dimensional information, in which the third dimension represents the multiple underlying frequencies.

For example, an object which appears orange may actually be emitting visible light in both the red and yellow wavelengths, or it may be emitting only a narrow band of light in the orange wavelength. In ordinary imaging, or our vision, we only see the combined average wavelength. Spectroscopy breaks down the spectrum to reveal which individual wavelengths are present and at what intensities.

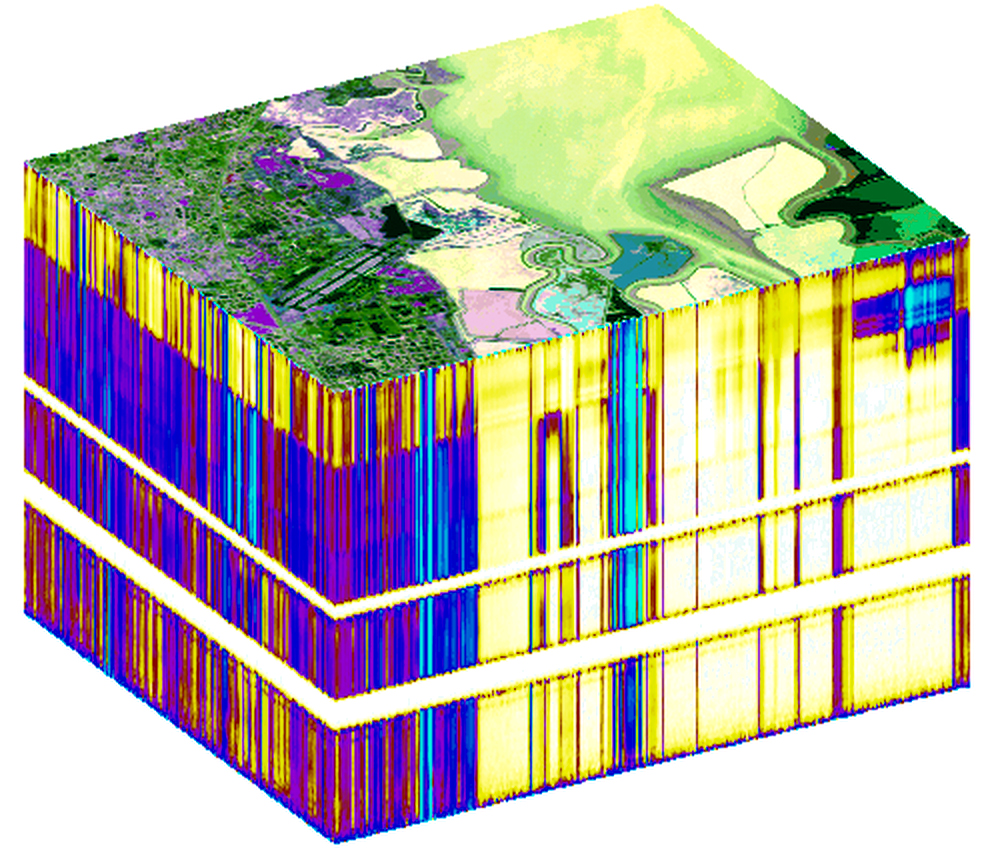
The information in a hyperspectral image may be represented as a data cube, in which one face shows a conventional image. The front edges of this face are shared by two other visible faces. These faces can then show the spectral lines, or spectral signature, for the pixels along these edges. These shows the actual frequencies of radiation present. It should be noted that these spectral plots are only shown for the pixels along these edges. The remaining part of the image is essentially a conventional image. However, within hyperspectral imaging software it is possible to move the slice through the image to view the spectral lines at any location desired.

Because hyperspectral imaging usually includes wavelengths outside the visual spectrum, it is considered as a form of spectral imaging. Spectral imaging uses a broad range of electromagnetic frequencies, beyond the red, green, and blue (RGB) spectrum of visible light. This might mean extending the visible spectrum into ultraviolet or infrared. It may also involve a completely different part of the spectrum such as x-rays and gamma-rays, or microwaves and radio waves. Because humans can only view the visible spectrum, other frequencies are represented as colors from the visible spectrum in a spectral image.


Comments

  1. Thaddeus James Vail says

    March 8, 2021 at 4:56 am

    i think this is genious!!! i want it!!!

  2. William Tucker says

    January 26, 2025 at 11:44 am

    So many uses for this, if you only knew.

Related Articles Read More >

DNA microscope offers new 3D view of organisms from the inside out
A tale of two industries: How manufacturing and medical imaging experts can learn from each other
Dark energy camera captures the glittering galaxies of the Antlia Cluster
R&D 100 winner of the day: Automated digital slide scanner, MSP 320
rd newsletter
EXPAND YOUR KNOWLEDGE AND STAY CONNECTED
Get the latest info on technologies, trends, and strategies in Research & Development.
RD 25 Power Index

R&D World Digital Issues

Fall 2024 issue

Browse the most current issue of R&D World and back issues in an easy to use high quality format. Clip, share and download with the leading R&D magazine today.

Research & Development World
  • Subscribe to R&D World Magazine
  • Enews Sign Up
  • Contact Us
  • About Us
  • Drug Discovery & Development
  • Pharmaceutical Processing
  • Global Funding Forecast

Copyright © 2025 WTWH Media LLC. All Rights Reserved. The material on this site may not be reproduced, distributed, transmitted, cached or otherwise used, except with the prior written permission of WTWH Media
Privacy Policy | Advertising | About Us

Search R&D World

  • R&D World Home
  • Topics
    • Aerospace
    • Automotive
    • Biotech
    • Careers
    • Chemistry
    • Environment
    • Energy
    • Life Science
    • Material Science
    • R&D Management
    • Physics
  • Technology
    • 3D Printing
    • A.I./Robotics
    • Software
    • Battery Technology
    • Controlled Environments
      • Cleanrooms
      • Graphene
      • Lasers
      • Regulations/Standards
      • Sensors
    • Imaging
    • Nanotechnology
    • Scientific Computing
      • Big Data
      • HPC/Supercomputing
      • Informatics
      • Security
    • Semiconductors
  • R&D Market Pulse
  • R&D 100
    • Call for Nominations: The 2025 R&D 100 Awards
    • R&D 100 Awards Event
    • R&D 100 Submissions
    • Winner Archive
    • Explore the 2024 R&D 100 award winners and finalists
  • Resources
    • Research Reports
    • Digital Issues
    • Educational Assets
    • R&D Index
    • Subscribe
    • Video
    • Webinars
  • Global Funding Forecast
  • Top Labs
  • Advertise
  • SUBSCRIBE