
R&D spending is a complex subject.
Considerations must be made regarding whether money goes toward basic research, applied research, advanced development, or product development, as well as how much money is spent each year. It also matters in which sectors that money is spent.
Funding must also be maintained continuously, as few technologies and products go from start to finish within a year. It matters if the money is spent to increase a competency, or to start one. Then, one must wait five to eight years to calculate the results.
These matters apply from a company view, a sector view, a country view, and a global view. Each domain has largely the same set of challenges and considerations.
Everyone generally agrees on two things. First, reductions in spending for multi-year periods have lasting consequences. Second, year-to-year up and down fluctuations have tangible implications. The effect is the same in corporations as it is for the venture capital (VC)-funded “maker” community. If VC funds dry up for extended periods, countries see a decline in start-ups, then IPOs, then Unicorns. So, R&D trends in spending matter quite a bit.
Information sources
There are two reliable sources that aggregate R&D spending information each year—the Business Research and Development Innovation Survey (BRDIS) and R&D Magazine‘s Global R&D Funding Forecast (GFF).
The BRDIS results each year through a contract between the National Center for Science and Engineering Statistics (NCSES) organization within the National Science Foundation (NSF) and the Census Bureau. By law since 2010, NCSES is the official Federal clearinghouse for the collection, interpretation, analysis, and dissemination of objective data on science, engineering, technology, and research and development. NSF tracking has gone on for decades before 2010; this is the current approach. The report comes out each August, for two years prior. The report for 2015 was released in August 2017. The NSF information can be useful in analyzing trends, but this is now 2018 and folks are planning for 2019 already. Time-to-market for most companies is two to three years and this lag in readily available information affects two to three product-planning cycles with respect to trends.
R&D Magazine’s GFF contains exclusive research findings and analyses of the upcoming year and beyond. It features insights on 100 countries, along with summaries on industrial sector trends, academic research, specific technology regions around the globe, and detailed spending plans by U.S. government agencies and industry.
Attendees of R&D Magazine‘s R&D 100 Conference get a glimpse of the GFF in November, and the full report is released to start the new year. The 2018 GFF just came out, featuring the global projection for R&D spending for 2018. It is easy to make the case that this is an important annual research contribution to the innovation community in our now globally competing environment with fast technology and product cycles.
The management science of R&D spending
Only recently, in the era of big data and analytics, has it become possible to assemble large enough data sets to begin studying the specific “investment vs. return on investment” results by industry sector, country, and globally. Right now, there is little generally available information for practitioners. Hence, determining how much or where to spend each year remains more art than science. Again, this applies at a company, sector, country, and global level.
For the past ten years, academics have been investigating the problem in search of answers to key questions, such as how much should be spent and is there a right amount to spend. One computationally-derived approach exists called “Research Quotient” which was published by HBR in an article entitled The Trillion-Dollar R&D Fix in 2012. In the years ahead, as super computing power becomes available to the masses, more people will tackle the problem. Ultimately, a new management science on R&D spending will emerge and the knowledge will become publically available. For now, a glimpse at available analyses and hypotheses costs significant money.
For the time being, like most scientists and engineers in the field who rely on their budgets, we are relegated to focusing on whether the budget will be consistent, go up, or go down, and, if so, by how much. Consistency is good. Consistent increases are even better. Few innovators and inventors will disagree with that.
U.S. spending trends
Noting again that the NSF data is in arrears, let’s use R&D Magazine‘s GFF data to examine recent trends. Globally, China, Korea, and the Scandinavian countries are making consistent waves. The data shows it. But, for this article, let’s just pull out the pieces from past and current GFFs for the U.S.
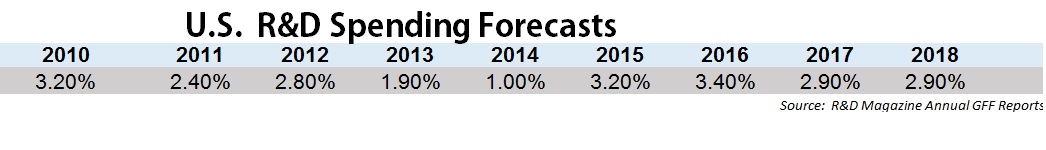
After flat lining for two years after the Great Recession of 2008, optimism returned to decision-makers of U.S. innovation funds. In 2010, spending jumped 3.2% when combining government, academia, corporate, and non-profit spending. However, optimism declined for the next four years as the realities of experiencing a prolonged slow period became clear. 3.2% went to 2.4% then 2.8% then 1.9% and 1.0% and we arrived at the end of 2014. As spending lags innovations by two to five years, it is no surprise that we have seen fewer IPOs on Wall Street since 2014. However, that is about to change.
Between 2015 and 2017, spending rose approximately 3.2% and the GFF projection for 2018 is in the ballpark at 2.9%. Four consecutive years of real spending increases are certain to result in a noticeably better innovation marketplace between 2018 and 2021-2022. At the moment, it is hard to find any macroeconomic data that says that this trend will not continue. Without going out on a limb, one could say the U.S. is headed for a stretch of seven to eight years of 3% annual increases. Of course, there are force majeures that could disrupt that, but absent extraordinary events; a prolonged period of annual spending increases is probable.
Positive outlook ahead
The 2017 survey conducted by the GFF team for 2018 indicates that more than a half-trillion dollars will be spent on R&D in the United States in 2018; $553 Billion. The Federal Government and other government agencies will spend $144B. Industry will spend $367.7B. Academia will spend $20.5B. Non-Profits will spend $20.8B.
If 3% annual increases are sustained for three more years, spending will top $600 Billion by 2021.
A possible breakthrough period
The U.S. is now three years into this stretch of real spending increases, and it bodes well for the next few years. More importantly, much like what happened in the prolonged period of spending increases after the 1990 recession that lead to the technology boom of the late 1990s, this would be the first seven to eight year stretch of meaningful annual spending increases since that time.
Approximately 22to 25% of all spending goes into basic and applied research, so eight consecutive years of meaningful increases in pre-product development technologies and capabilities is a big deal—never mind product development. It possibly portends another great era of leapfrog advances and technological disruption.
It is a great time to be a scientist or an engineer, whether you have gray hair or are just entering the workforce. Innovators and inventors allocate a great amount of their time to economic trade-offs and sub-optimizing possible innovations from their work in light of annual budget and economic fluctuations. The U.S., and possibly the world as a whole, is entering a period where thought leaders can concentrate on their craft and focus on coming up with the next best and big thing.
If the science of how much and where to invest R&D monies advances during this same period, as it is likely to do, the precision at which we will have spending discussions in the mid 2020s will also be a next big thing in R&D management science. The mid-2020s are likely to be very exciting and comparable to the technology boom of the 1990s.
Bradford L. Goldense is founder and president of Goldense Group Inc. (GGI; www.goldensegroupinc.com), a consulting, market research, and education firm focused on business and technology management strategies and practices for product creation, development, and commercialization. He also presented the talk, “Optimizing R&D Performance Through Metrics” at the 2017 R&D 100 Conference.