According to measurements from the National Oceanic and Atmospheric Administration’s Mauna Loa Observatory in Hawaii, atmospheric carbon dioxide concentrations averaged approximately 431 parts per million (ppm) last month, a record high.
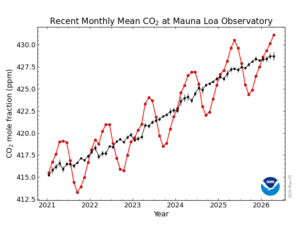
Data from Mauna Loa Observatory
In 1958, when continuous monitoring began, levels were below 320 ppm. Before the Industrial Revolution, levels were approximately 280 ppm or less.
NOAA data shows that the average monthly amount of carbon dioxide has been steadily increasing since 2021. There was a slight reduction in U.S. emissions in 2023 and 2024, but this trend was reversed in 2025, possibly due in part to the energy demands of data centers.
A budget proposal for NOAA for the 2027 fiscal year proposes cutting funding to numerous climate monitoring facilities, including Mauna Loa. This could lead to the foundational record of rising CO2 losing its primary data source.
Mauna Loa is positioned at 11,141 feet above sea level, allowing for sampling of air representative of the mid-troposphere in the Northern Hemisphere. By capturing air masses that have been mixed over thousands of miles of the Pacific Ocean, Mauna Loa provides a “memory” of the changing atmosphere, offering a record that is largely untainted by localized pollution and reflects the true baseline of global greenhouse gas concentrations.
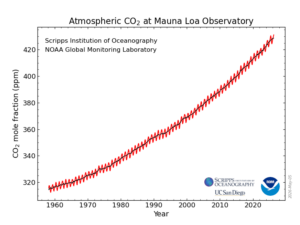
Data from Mauna Loa Observatory
In 1958, Charles David Keeling, an oceanographer, initiated the first systematic, long-term measurements of atmospheric CO2 at Mauna Loa. These observations resulted in a curve that came to be known as the Keeling Curve, where CO2 levels peak in May before dipping during the Northern Hemisphere growing season.
Creating redundancy, NOAA and Scripps
To maintain the integrity of global CO2 data, scientists use dual, independent measurement systems. Both the Scripps Institution of Oceanography and the NOAA Global Monitoring Laboratory collect observational data at Mauna Loa, employing separate instruments and distinct sampling protocols.
The two programs provide a cross-verified baseline that can withstand technical failures, sensor drift or local environmental interference. The framework relies on both continuous on-site measurements and a global network of stations to verify that the trends observed at Mauna Loa are reflected across the planet.
NOAA Global Monitoring Laboratory maintains the primary independent long-term record at Mauna Loa, and has done so since 1974. It also operates a globally distributed sampling network to diagnose regional sources and sinks.
The Scripps Institution operates the original Keeling Curve program and manages 14 global sampling stations dedicated to verifying global trends.
Data integrity
To ensure the measurements taken at Mauna Loa are not skewed by the noise of local influences such as volcanic activity or nearby vegetation, data must pass background air criteria.
The air must be representative of mid-altitudes over the Pacific, having mixed for several days to smooth out regional variability. Automated systems detect and purge spikes caused by emissions from the Mauna Loa volcanic crater.
The data is also filtered to remove fluctuations caused by the daily photosynthetic cycles of island vegetation.
This selection process creates a distinction between hourly and daily averages. The reported daily average is computed exclusively from the subset of hourly values that satisfy all background stability conditions. This ensures that ground-level measurements are representative of the global atmosphere.
Computational synthesis
Scientists use the Global Greenhouse Gas Reference Network dataset to integrate regional data into a global trend. They use bookkeeping models such as BLUE, OSCAR and LUCE to estimate net CO2 from land-use change and forestry. These models account for time-varying carbon densities in biomass and soil, which fluctuate due to factors such as the CO2 fertilization effect.
The researchers use diagnostic tools, such as CarbonTracker, to work backward from atmospheric concentrations to pinpoint the geographic locations of carbon sources and sinks.