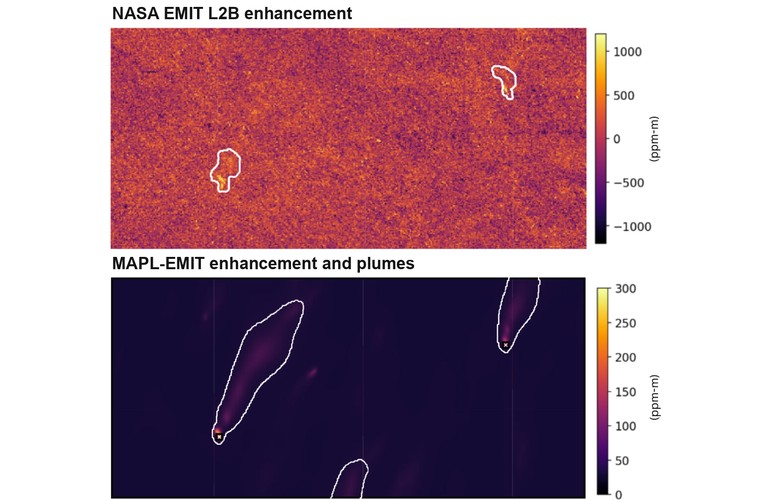
NASA’s standard EMIT methane product (top) and MAPL-EMIT output (bottom) for the same scene. Image: Adapted from Batchu et al., PNAS (2026), CC BY 4.0
Google and NASA researchers have trained an AI model to find methane plumes that conventional satellite analysis misses, recently featured in a video posted on YouTube. In a test covering 1,084 observation scenes from NASA’s EMIT imaging spectrometer aboard the International Space Station, the model, Methane Analysis and Plume Localization with EMIT (MAPL-EMIT), identified about 50% more plausible plumes than human analysts, expanding the set of potential emissions sources for further investigation.
The study, published Sept. 1 in the Proceedings of the National Academy of Sciences, tackles a bottleneck in monitoring methane from oil and gas infrastructure, coal operations and landfills. Methane traps more than 80 times as much heat as carbon dioxide over 20 years, making large leaks a target for near-term emissions cuts. The model combines the gas’s distinctive infrared absorption pattern with the shape of a plume, thus helping distinguish emissions from misleading features on the ground.
Training that model required far more examples than researchers could label by hand, so the team turned to physics-based simulation to generate them.
Learning the shape and spectrum of methane
NASA’s Earth Surface Mineral Dust Source Investigation instrument, or EMIT, was built to study mineral dust. Mounted on the International Space Station, it scans an 80-kilometer-wide swath at 60-meter spatial resolution and records 285 narrow spectral bands. Those measurements also capture the wavelengths at which methane absorbs sunlight, revealing gas that ordinary visible-light images cannot show.
Conventional matched filters look for that absorption signature one pixel at a time. They estimate the background from many pixels, which can introduce errors when bright roofs or other surfaces resemble methane’s spectral pattern. They also lack the spatial context needed to recognize a plume stretching downwind from a source.
Conversely, deep learning approaches offered a way to read spectrum and shape together, but it needed far more labeled data than existed. “Reliably detecting both the spectral signature of methane and the plume shape requires deep learning and lots of labeled plumes,” the narrator says in a Google Research video on the study embedded above.
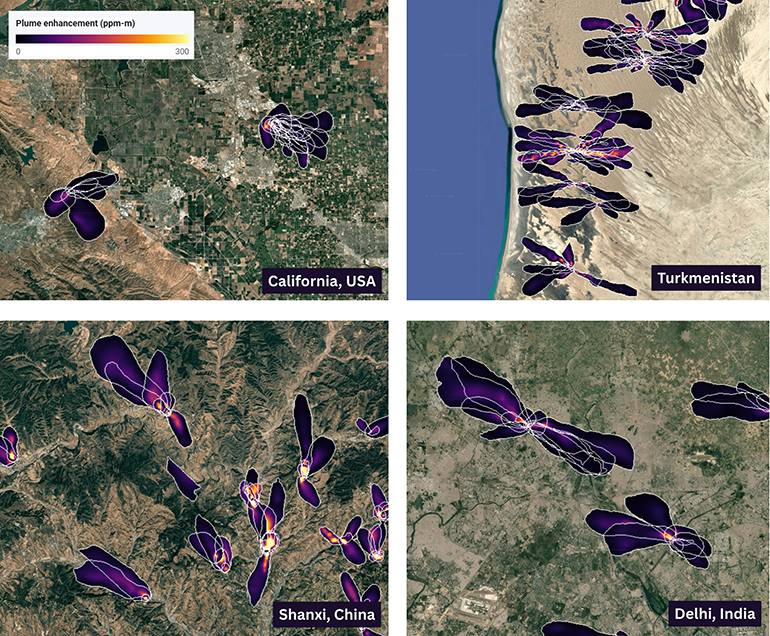
MAPL-EMIT methane detections over four emission hotspots: California, Turkmenistan, Shanxi province in China, and Delhi, India. Each white outline is a plume detected on a separate EMIT overpass. Colors show methane enhancement in the atmospheric column, from 0 to 300 ppm-m, not emission rate. Image: Google Research
Only a few thousand labeled plumes were available, the narrator continues, so the team built a physics-based atmospheric simulation, known as a Lagrangian puff model, that tracks how puffs of gas drift and spread in turbulent wind.
Ultimately, the simulation produced 3.6 million plumes, including overlapping plumes from neighboring facilities. Using methane absorption data from the HITRAN spectroscopic database, the researchers inserted those synthetic signals into about 235,000 real EMIT image tiles, each 256 by 256 pixels. That gave the model examples of known methane distributions against varied real-world backgrounds.
MAPL-EMIT uses a Swin-v2 vision transformer to analyze spectral information and neighboring pixels together. It estimates methane enhancement above background, outlines individual plumes and predicts their origins. On simulated test data, its estimated source locations fell an average of about 100 meters from the true origin, close enough to point toward an individual facility. Separating plumes that merge downwind matters when nearby facilities could otherwise appear to share one emission source. The system also checks candidate detections against the expected methane spectrum.
What the map can establish
The Earth Engine catalog distinguishes high-confidence plumes observed at least three times from medium-confidence candidates without a temporal match. Human review of random samples found false-positive rates of about 3% to 5% for the high-confidence group and 50% to 55% for the medium-confidence group. The latter need additional screening against infrastructure, spectral evidence and local wind. The output also measures methane enhancement in the atmospheric column, rather than an emission rate in kilograms per hour. Estimating that rate requires wind data and further calculations. Those distinctions matter when using detections to investigate a facility or compare its emissions over time.
Google has released the plume catalog through Earth Engine, inference code on GitHub, and model weights and synthetic training data on Kaggle. Researchers and operators can use the catalog to select sources for follow-up, inspect repeated observations and compare model predictions against field measurements.



Tell Us What You Think!
You must be logged in to post a comment.