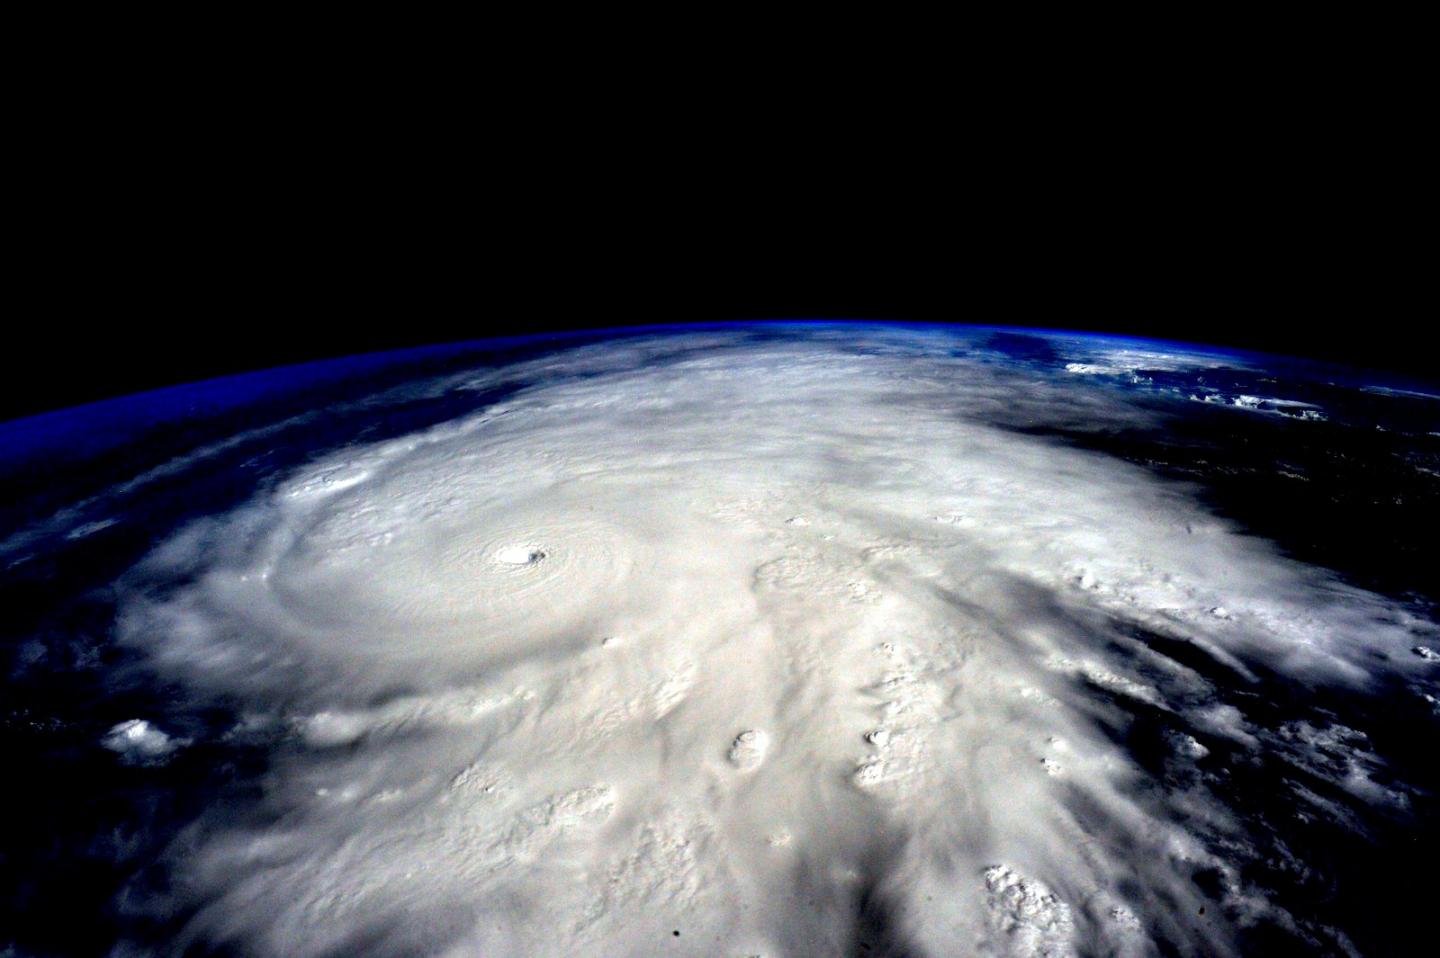
Satellite image of hurricane Patricia showing the boundary layer. Credit: NASA
Improving forecasting for a host of severe weather events may be possible thanks to a more comprehensive method for measuring the Earth’s boundary layer depth, developed by Penn State researchers.
The boundary layer is the layer of atmosphere that is closest to the Earth, less than one mile from the surface. Because it is the layer that is most affected by the convective heat from the Earth’s surface, it is responsible for sudden weather shifts such as thunderstorms.
The boundary layer gets its name because it traps things such as pollution, smog, smoke from forest fires, and other airborne particles from rising higher in the atmosphere. As sun warms the surface of the Earth, it also warms the air. This warm air rises, deepening the boundary layer.
In research published in the Journal of Atmospheric and Oceanic Technology, researchers demonstrated how 159 currently operating weather radars could, in real time, track boundary layer depth, which constantly ebbs and flows. That is important because boundary layer depth is currently measured twice daily by launching weather balloons from about 100 locations nationwide.
In addition to being gathered in real time, radar measurements give a more complete analysis of the boundary layer by sending out vertical and horizontal impulses to log if snow, rain or insects are present.
Inaccuracies in boundary layer assessment lead to significant errors in forecasts, said John Banghoff, graduate student in meteorology, Penn State. Banghoff said those inaccuracies are leading to poor forecasting results.
“If we can improve the accuracy of the initial information, that’s going to get a better forecast in the future,” Banghoff said. “Boundary layer estimates are off by a factor of two in most models, which is very significant. If you have 200 percent error in your model, it’s not going to do a very good job.”
In addition to severe weather modeling, understanding boundary layer depth could improve models for air pollution and wildfire forecasting. A 2009 report by the National Research Council highlighted limitations of boundary layer depth monitoring as a major concern, citing that other monitoring methods should be explored.
Researchers used the Weather Surveillance Radar-1988 Doppler (WSR-88D) radar in Central Oklahoma to test the ability of radars to assess boundary layer depth. Banghoff said the radars offered better spatial resolution than weather balloons and were just as accurate at predicting boundary layer depth, based on results of this research. These methods were also tested in eight different regions across the country, in locations such as Minnesota in February to Arizona in August, demonstrating the seasonal reliability of this method.
“We showed that the weather balloons, which are the baseline, compare pretty well with the radar observations. Once we found that the radar offered accurate information, we began using radar data to track boundary layer depth throughout the day.”
Researchers then plan to use this newly sourced radar data to fit into models, to see if the real-time data improves the models. They will use more than four years of archived data to further explore and refine the models.
Warm air creates a cap on the atmosphere, trapping cooler air below. During severe weather events, Banghoff said, the air below will heat up and pierce that cap, creating massive cumulonimbus storm clouds.
Banghoff said a similar phenomenon can be observed at the Earth’s surface during fog events, where droplets of cool, moist air are trapped by the warmer air from above.
“It’s kind of an obscure thing,” Banghoff said. “People don’t know what the boundary layer is but when you put it into context of wildfires and air pollution and severe storm forecasting then it has a lot of relevancy.”