What is the right set of metrics for tracking innovation impact inside a large company?
Can you really run an R&D center or innovation lab without collecting any metrics?
My company, Innovation Leader, a community for executives responsible for innovation in large organizations, tackled those two questions as part of a survey we fielded earlier this year. We received 270 qualified responses from corporate leaders in strategy, innovation, and R&D roles. Some are involved in overseeing established R&D teams with hundreds of employees, but others are involved in newer innovation initiatives at companies that haven’t historically had an R&D department — for instance, in a financial services or hospitality business. (Full survey results are available here.)
For the purposes of our survey, we created two categories of metrics: non-financial metrics and financial metrics. The former would include tracking activities like “number of startups we’ve met with” or “peer-reviewed papers we’ve published,” while the latter would include more concrete outcomes like market share increases or improved worker productivity. We also asked companies to classify themselves on a spectrum of innovation maturity, from less mature to more mature, when it came to organizational support, commitment, and the sophistication of their innovation-related systems.
Non-Financial Metrics
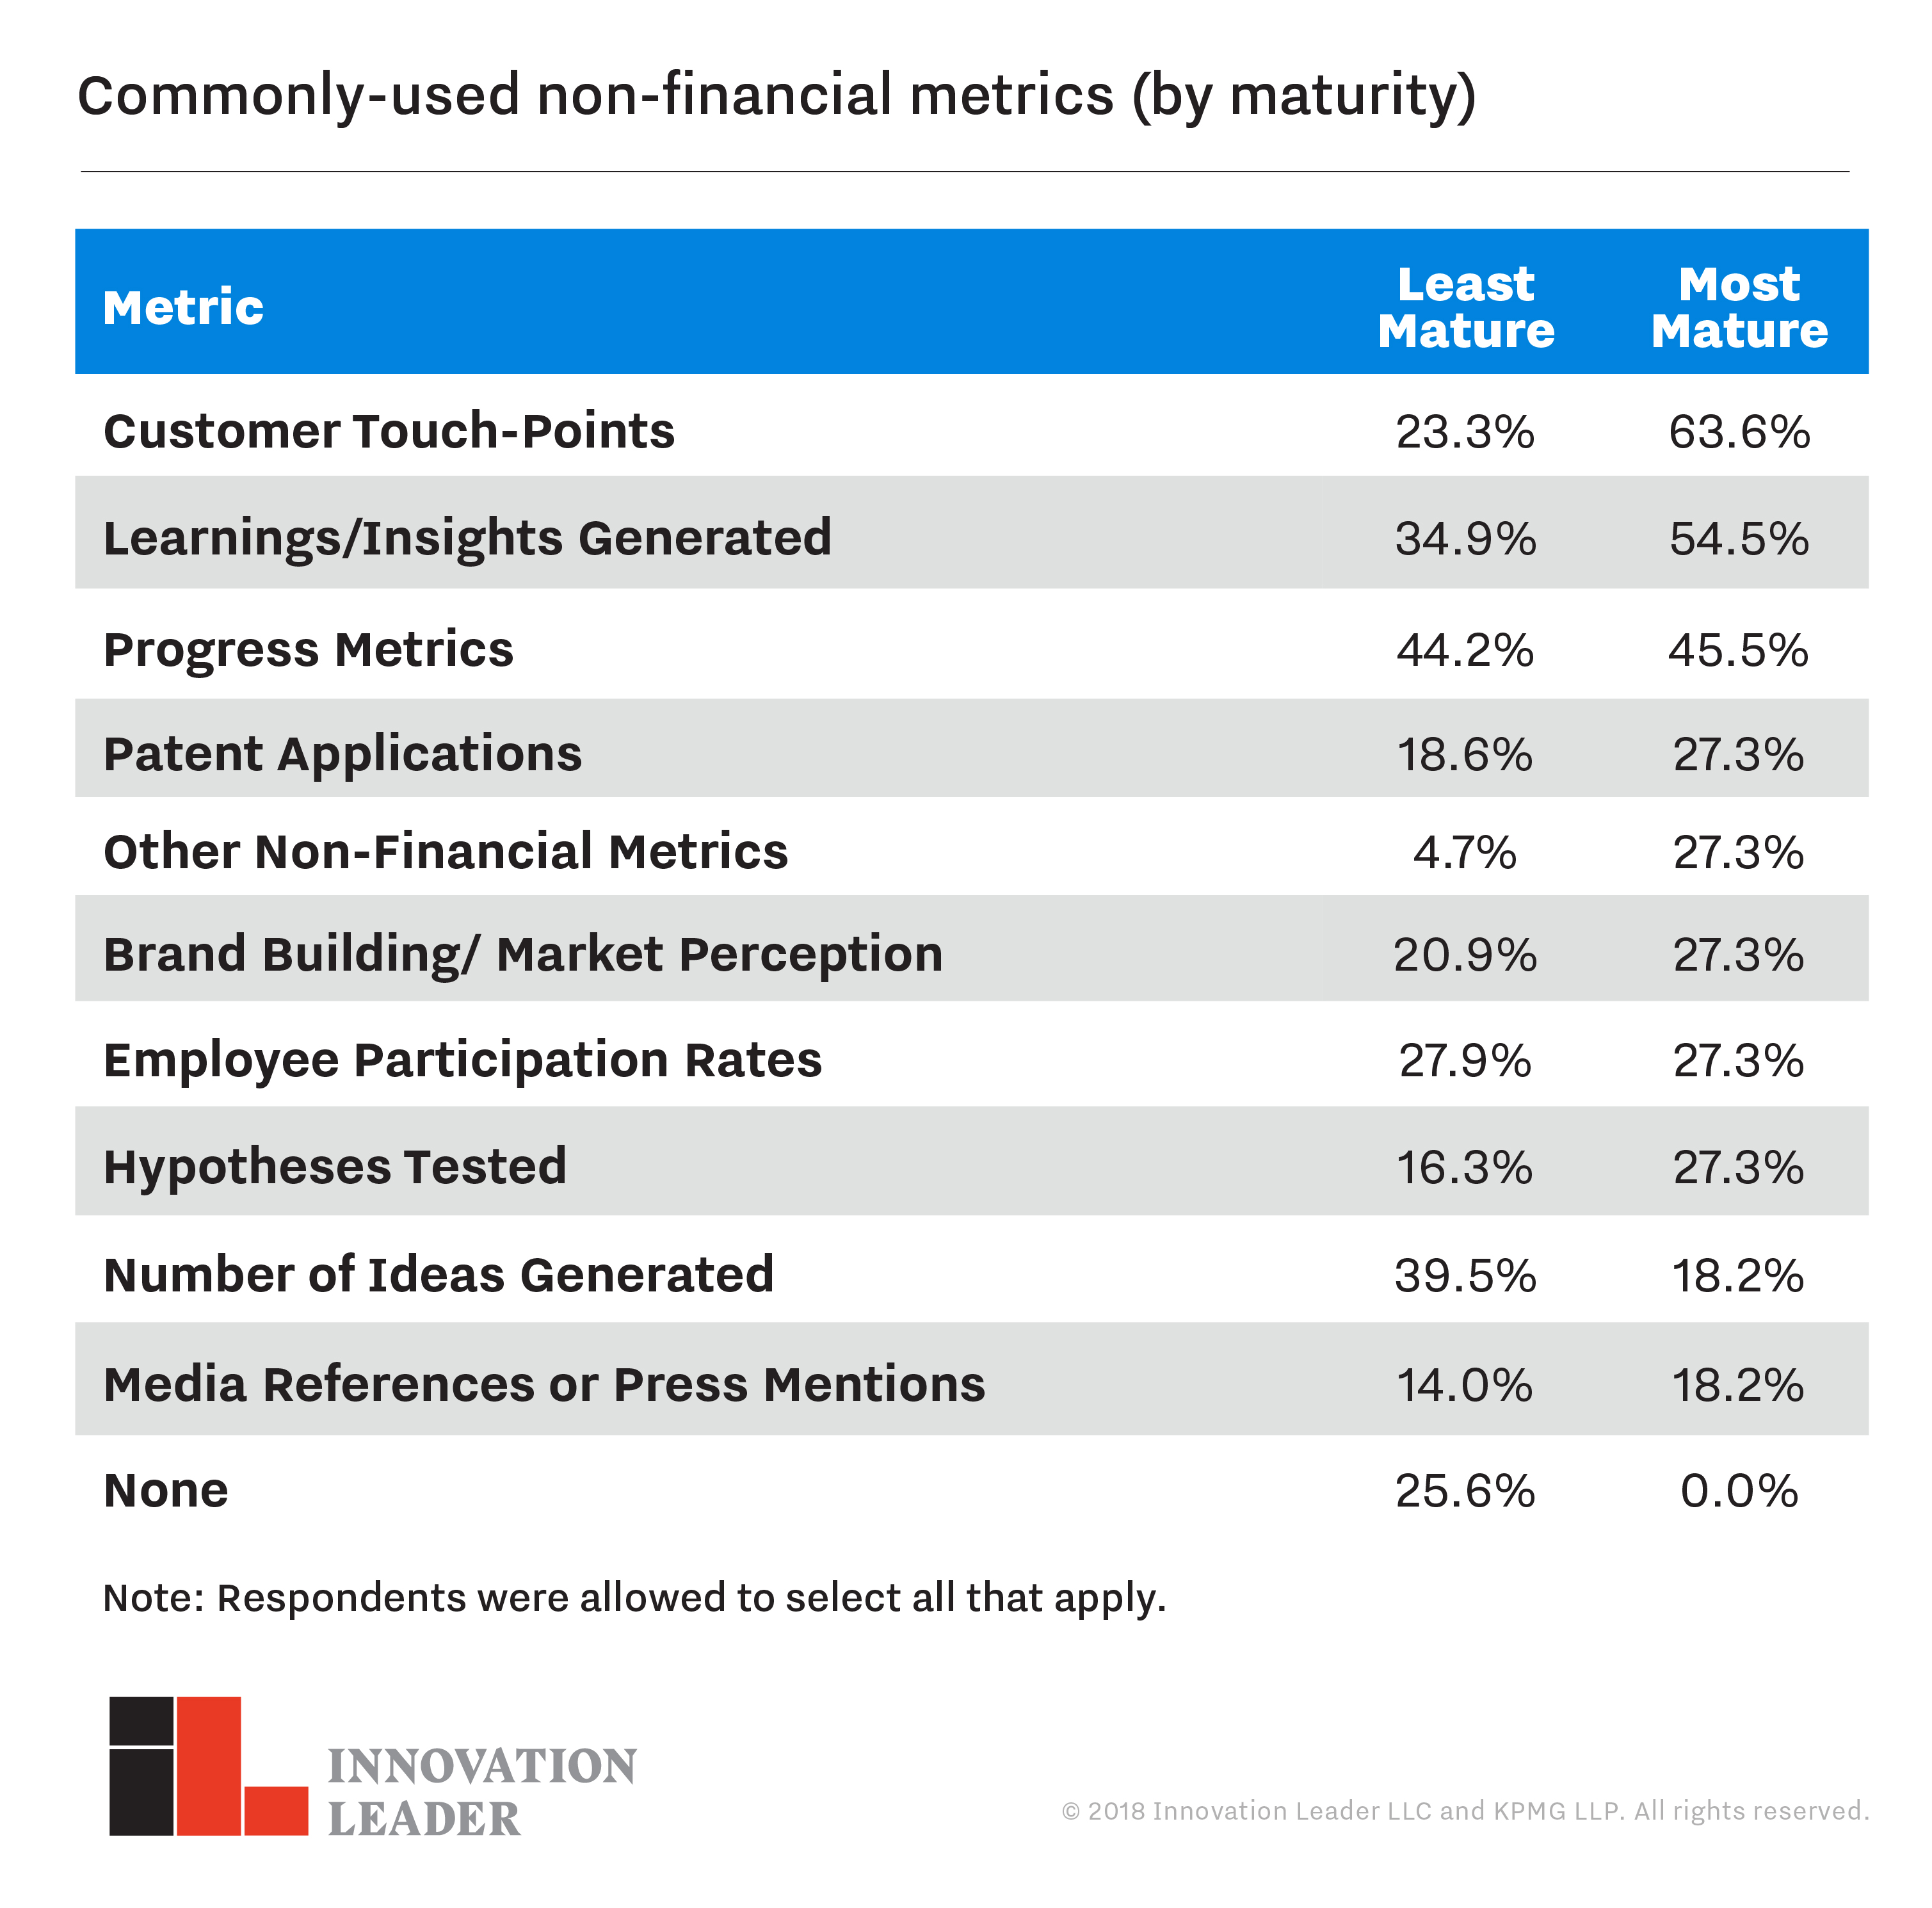
The most common non-financial metric used by companies to measure the efficacy of their innovation programs was progress metrics, cited by 60 percent of respondents. These metrics typically gauge things like how fluidly projects are attaining certain milestones or moving through “stage gates,” but not the financial impact of those projects. Nevertheless, these progress metrics can be an early proxy for success, before a new innovation group has moved concepts into production internally, or seen them launched in the market.
The second most common non-financial metric being used was “learnings” or “insights generated.” Slightly fewer than half of respondents (46 percent) are using those as metrics, but the figure was higher for the most mature companies (55 percent) than the least mature companies (35 percent).
The most mature companies in our data set also tell us that they are gathering metrics related to customer touch-points and interactions (it was the top non-financial metric in use at the most mature companies.) Those activities suggest an organization that is in regular contact with customers to get their input, and able to test new concepts, incorporate feedback, and iterate.
Of the “top ten” non-financial metrics our survey respondents are using, patent applications or patents granted showed up as number eight, used by one-quarter of respondents. That put it slightly ahead of press mentions.
Financial Metrics
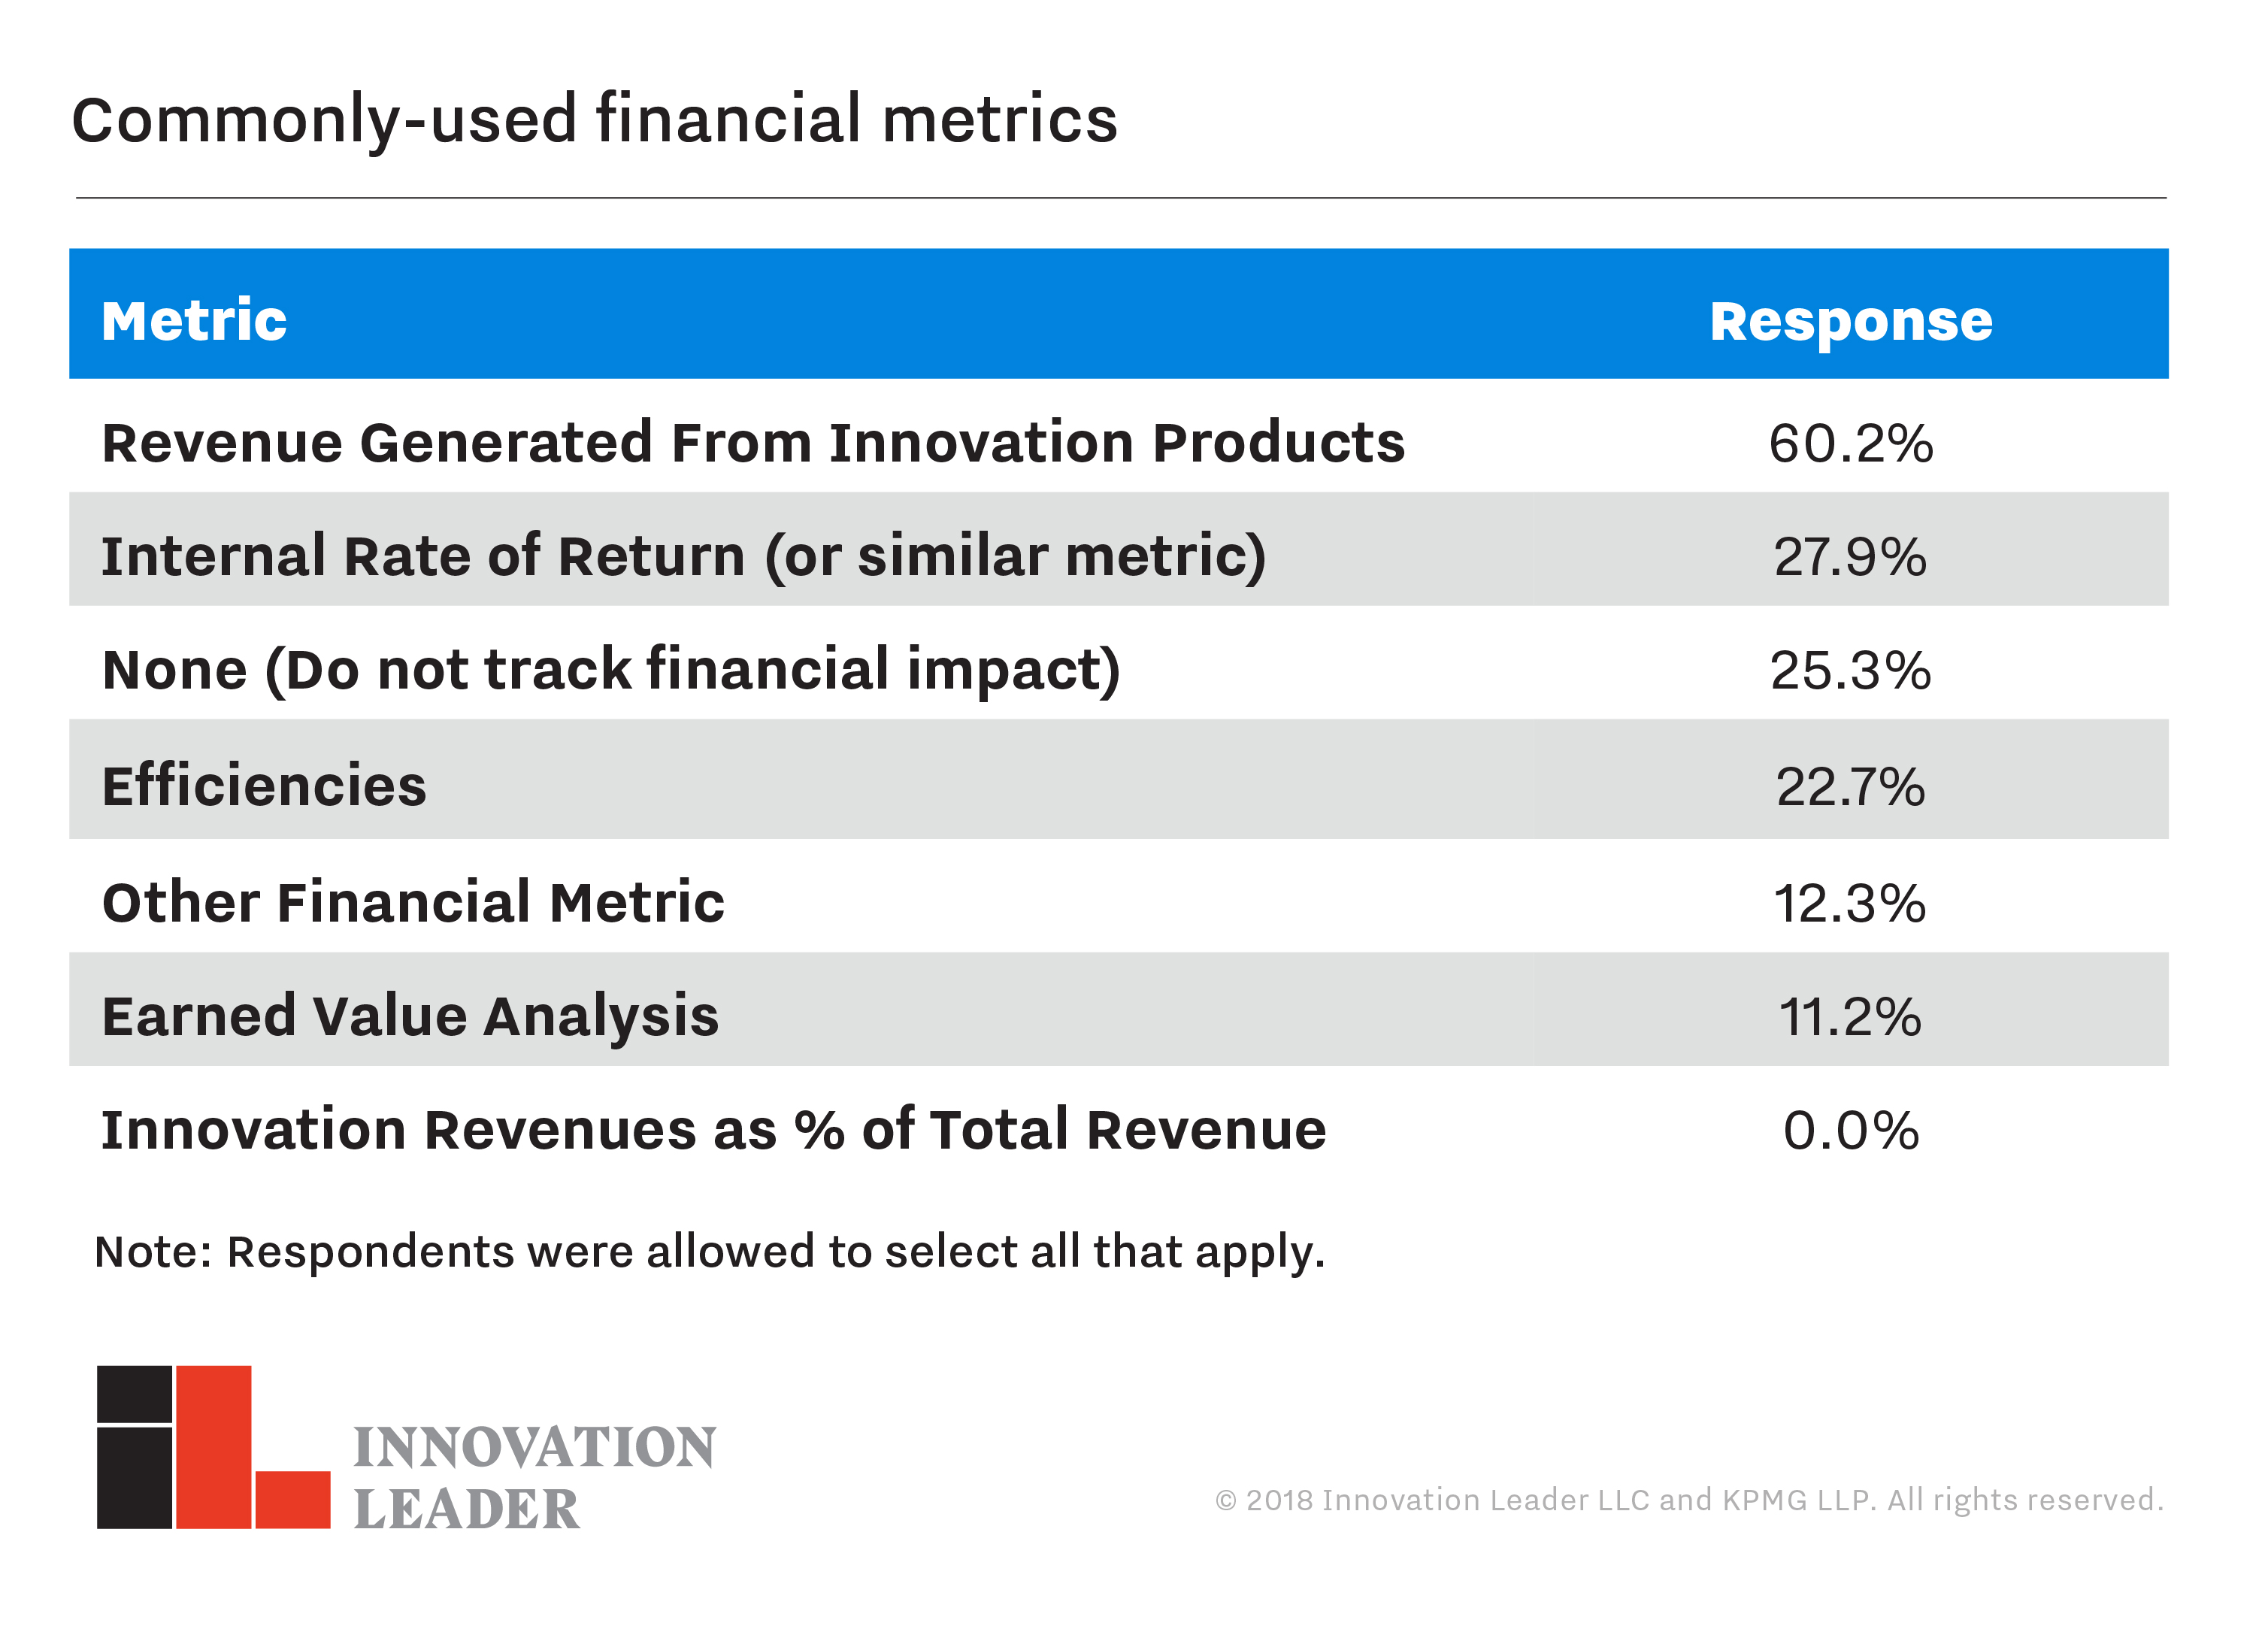
By far, the most commonly-used financial metric was “revenue generated from innovation products,” which was cited by 60 percent of respondents. This is an indicator that every CEO and CFO can buy into, so for many companies it is the default data point. But moving the needle significantly on this measure can take years. Slightly more than one-quarter of respondents (28 percent) said they track “internal rate of return (IRR)” or a similar metric; IRR is used to estimate the profitability of internal investments. Twenty-two percent of respondents told us that efficiencies or cost savings are an important metric.
Several respondents provided additional detail on their metrics, noting they specifically track “margin generated from innovation products,” project profitability, or cost of development.
With Maturity, Revenue Grows in Importance
A few other points become clear when comparing respondents who categorized themselves in the two least mature stages with respondents who put themselves in the two most mature stages. It’s much more likely that mature companies track revenue generated from newly-launched products or other ideas that have been deployed in the business.
This a classic measure of how well a new product development engine is operating. But based on the company’s definition of what counts as a “new” product, it may reward line extensions and creating Version 2.0 of existing products, rather than activity that would count as more ambitious adjacent or transformational innovation.
While there was almost no variation between the financial metrics tracked at large companies compared to those tracked at small companies, the respondents’ industry actually did have an impact.
For example, only 39 percent of respondents at financial services firms tracked revenue generated from innovation-related products, but that metric was monitored by 82 percent of respondents at technology companies. That may be because technology companies have faster cycle times for creating new products, so they may have more in-market to measure and track. They are subject to far less regulatory oversight than a brokerage or bank. This data point is also aligned with survey data regarding organizational maturity; a higher percentage of respondents from the technology industry claimed they were further along on the maturity spectrum than financial services companies.
Not Collecting Metrics
Somewhat incredibly, one-quarter of respondents told us they do not collect financial metrics related to their innovation program at all. That number, however, was highest among the least mature companies; only 11 percent of respondents at the most mature companies said they aren’t gathering financial metrics.
Companies that are early in their innovation journeys—again, often in industries that haven’t had R&D groups in the past—may not yet know what their focus will be, are trying several different activities to see what will deliver value, and haven’t yet put in place a measurement regime.
But the flip side of that phenomenon is more established companies that may have in place an extensive metrics dashboard, but are measuring things that senior leadership doesn’t care about.
The best solution is involving those senior leaders in shaping a metrics regime that works for them, and works for the innovation or R&D group. This typically includes a mix of financial and non-financial indicators, and highlights both short-term activity and longer-term payoffs.
That kind of collaborative discussion is also a good way to avoid “metrics overload,” where you’re spending more time gathering data about innovation than you are actually innovating.
Scott Kirsner is Editor and Co-Founder of Innovation Leader, a community of senior executives in innovation, strategy, and R&D roles. He also writes a weekly column for the Boston Globe, “Innovation Economy,” and has contributed to Harvard Business Review, the New York Times, Fast Company, and Business Week.