
Anne Marie Knott is the Robert and Barbara Frick Professor in Business at the Olin Business School, Washington University.
By Anne Marie Knott
To set the stage for a discussion of R&D metrics, let’s understand why companies do R&D in the first place. This takes us back to the beginning of the 20th Century. Companies formed labs to create new opportunities. In some cases, this was because existing business was disappearing and needed to be replaced, as when the government decided to compete with DuPont in manufacturing explosives. In other cases, it was exploiting new markets related to companies’ existing capability, as when Standard Oil recognized the emerging market for automobiles was going to create demand for gasoline. Until that time, gasoline was merely a byproduct of their kerosene production.
In this early world, R&D drove corporate direction and profits, rather than the other way around. R&D proposals were quite simple in this world. When I worked at Hughes Aircraft Co. for example, our proposals fit on a one-page form. It included your name, the project title, the goal, the approach, and an estimate of the number of people and the amount of time the project would take. These proposals ultimately made their way up to the College of Cardinals (senior management, who themselves were PhD scientists and engineers). They would decide whether each project had merit or not, while we all waited for the white smoke to appear. There was no need to quantify the returns because the company ethos was “do the right thing and profits will follow.”
Enter financial management
That world changed when Hughes was acquired by General Motors. During the next R&D proposal season, I submitted my form, waiting to hear back from the College of Cardinals. Instead, it came back from accounting. They said, “We need the ROI (Return on Investment) for your project.” I said, “that’s crazy. This project is 20 years away from commercialization, if it ever gets commercialized. There’s no meaningful ROI for it.” To which accounting replied, “It’s a new world, you have to have one.”
I had my MBA by that point, so I could create an ROI with the best of them. I identified a number of feasible products that could emerge from the technology, estimated revenues and profit streams from them, assigned probabilities that each of them would materialize, discounted them forward, then divided by R&D to compute ROI. The expected ROI was 2,047%! It was completely defensible, but it was also ridiculous. This is not the way to make investment decisions for long range projects under high uncertainty.
Hughes wasn’t alone in this shift. Most other organizations were converting to “financial management” at that time. The underlying premise of financial management is that anyone can run a company as long as they have the numbers. The problem with financial management is that some things have numbers and some things don’t.
 Let’s look at an example from consumer-packaged goods (CPG), where trying to bring a number like 2,047% is like bringing a knife to a gunfight. Nobody believes it (nor should they!), but there isn’t really any alternative number.
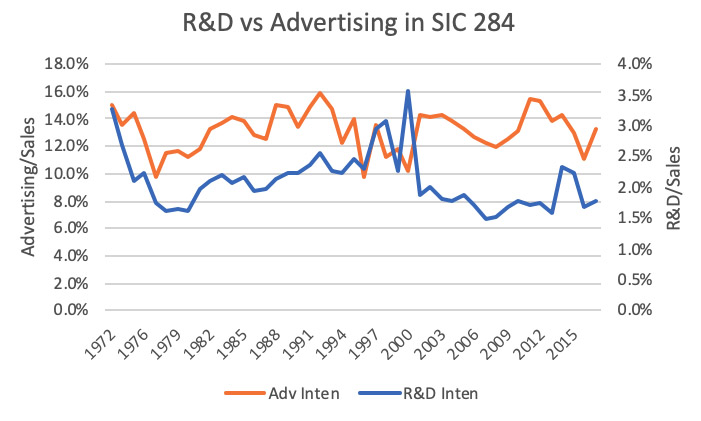
We’ll start the examination of CPG in 1972, before financial management. Even then, advertising received greater investment than R&D — 13.5% of sales versus 3.3% of sales. There has been some bouncing around since then, but basically, advertising has retained its percentage of sales — whereas R&D’s has been cut in half. I believe the reason R&D investment has declined is that while the returns on advertising appear within the budgeting period, that’s not true for R&D. You have to take on faith the returns will ultimately materialize. But faith is hard to defend in budget meetings.
The problem is if you stop doing R&D, there’s nothing left to advertise, which you can now for CPG. If you go into the packaged goods sections in grocery stores these days, there’s basically one branded product, and everything else is store brands. These companies haven’t done much new since P&G introduced Crest White Strips.
 So, the first fallout from financial management is that R&D spending falls. The second fallout, which is really a byproduct of the first, is that you cut the meat of R&D as you are cutting the fat — you lose the capability to do R&D. This is precisely what has happened — on average, companies’ R&D productivity has declined 65%. This isn’t just bad for the companies and their shareholders. It’s bad for the entire economy, because innovation is the primary engine of economic growth. As you can see at right, R&D productivity is highly correlated with GDP growth, so this decline in R&D productivity is the reason growth is stagnant in the US.
Introducing a new gun
The measure of R&D productivity in the chart above is called RQ (short for research quotient).
RQ is intended to be the company equivalent of individual IQ. It’s how smart they are. So just as high IQ individuals solve more problems per minute, high RQ companies essentially solve more problems per dollar of R&D. RQ is the new gun for R&D to bring the budget fight.
 The foundation for RQ is Paul Romer’s theory linking R&D to growth, for which he won the Nobel Prize in 2018. Romer’s theory rests upon something called the production function, which links companies’ inputs to outputs. The two inputs typically considered are capital and labor. These are represented by the two axes in the figure below, and the outputs you might think of as numbers of widgets, represented by the curves or isoquants. Think of the inner curve as 100 widgets, then 200 widgets, and 300 widgets as you move outward. What you can see from the figure at right is that you produce 100 widgets with a lot of capital and very little labor, a lot of labor and very little capital, or any of the infinite combinations along the inner curve. One of the things this production function helps you understand is where on that curve to be — what’s the appropriate tradeoff between capital and labor.
Romer’s insight was to say, “There’s an important input missing here — knowledge.” The role of knowledge is to make you more productive with any given level of capital and labor (the curves move outward). So instead of making 200 widgets, with the original levels of capital and labor, you’re now making 250 widgets.
Where does knowledge come from? Not surprisingly, it comes from R&D, and in particular, Romer’s theory specifies that the amount of new knowledge you get is a function of the level of R&D investment, how much knowledge you had to begin with, and how productive you are in converting R&D into new knowledge (R&D productivity).
What’s most exciting about Romer’s theory is its conclusion: the economy will continue to grow in perpetuity as long as you continue to invest in R&D. In fact, Romer makes a very specific prediction, which is that the rate of growth will be proportional to the level of R&D. So, if you double the level of R&D, you should double the growth rate, right?
 Historically, this was true, as you can see from the chart at right. R&D spending (blue dots) rises in the 1950s and 1960s, falls in the 1970s, picks back up in the 1980s, and has basically been constant since. GDP growth (red dots) tracks the R&D spending with about a 5-year lag, through the rise, through the fall, but it never picks back up again when R&D spending does. Was Romer wrong? Should we take his prize back? The answer, of course, is “no.”
What has happened is that R&D productivity (RQ) has declined. As you saw in figure 2, GDP growth follows R&D productivity. It will only track R&D spending, if productivity stays the same … but it hasn’t. It has declined 65%, which means that the growth that companies derive from R&D is only 1/3 what it was in the 1970s. The great news is, if we can reverse the decline in RQ, we should restore GDP growth.
Romer’s theory may seem irrelevant, because it is at the level of the economy, but all of his mechanics really apply to companies because the production function is a company-level construct. In addition, R&D productivity (RQ) is a company-level construct.
The technical definition of RQ is the “company-specific output elasticity of R&D.” While elasticities are meaningful mainly to economists, they have a nice practical translation. RQ measures the percentage increase in revenues you expect from a one percent increase in R&D.
Moreover, because RQ rests on theory, it supports predictions about the impact of changes in R&D on company growth and market value. It also allows you to identify the optimal level of R&D — the amount beyond which a new dollar of R&D generates less than a dollar of profits.
If the theory is any good, and if RQ truly captures R&D productivity, then these predictions should hold when you test them with data. It turns out they do for using data for all publicly over 47 years of data. So Romer’s theory appears to be valid, and RQ seems to capture its R&D productivity. How can we put RQ to work in helping companies?
Using the gun
While CTOs may want RQ principally for the budget gunfight, it actually has other, arguably more valuable, uses. I review five of them here:
• Setting the R&D budget
• Justifying that budget (ROI) to the CEO and investors
• Attracting long-horizon investors — the ones more likely to grant you discretion to “do the right things”
• Fending-off short-horizon (activist) investors
• Supporting continuous measurable improvement in your R&D capability — the R&D equivalent of Total Quality Management (TQM) for manufacturing
1. Setting the R&D Budget. Currently, the most common method for setting R&D budgets is to use rules of thumb, such as a percentage of sales (on average about 2 to 3% of sales). While rules of thumb often reflect collective wisdom, in the case of R&D that wisdom is outdated. That’s because the rules were established when companies were better at R&D — when their RQs were three times their current values. Consequently, 63% of companies are now overinvesting in R&D. On average, these companies could earn $258 million higher profits by decreasing their R&D budgets. On the flip side, another 33% of companies are underinvesting in R&D. On average, they could earn $36 million higher profits by increasing their R&D budgets 10%.
Knowing your company’s RQ allows you to avoid that problem by identifying the level of R&D that maximizes profits. Not only can you identify the correct R&D investment at the company level, you can determine how to allocate that R&D more effectively across the divisions, which will increase profits even further. Better still, when divisions know their R&D budgets are based on their RQ, they will work to improve their RQ — making each R&D dollar drive greater growth and market value.
2. Justifying the R&D budget. Knowing the optimal R&D is the first step, but you also need to justify that budget to survive the budget fight with marketing and manufacturing. Fortunately, once you know your RQ and the proposed level of R&D, it is easy to calculate expected revenue and profits. The ROI then, is simply the expected profits from R&D divided by the corresponding level of R&D. This ROI is the R&D equivalent of the ROIs for advertising and capital investment.
So, CTOs now have the same gun as marketing and manufacturing when they enter the annual investment fights. The great thing is, if the CTO is successful in one year, revenues and profits will increase in subsequent years. This means more investment money for everyone in the future. So RQ takes the current zero-sum budget game and converts it to a positive sum game. And the game doesn’t end in the budget meaning. CEOs can bring the same gun to their fights with analysts and investors.
3. Attracting long-term investors. In the past, CTOs have complained that investors keep them from doing the right things. This is because investors didn’t have a way to value R&D. As a prime example of that, Warren Buffet has historically avoided tech stocks because he lacked a good way to value them. RQ allows R&D assets to be valued in an equivalent way to capital assets. Investors who recognize that, earn higher stock returns, as illustrated in the figure below.

The figure presents the stock returns for three portfolios, the low RQ50 (the 50 public companies with the lowest RQ in each year), the high RQ50 (the 50 public companies with the highest RQ in each year), and the S&P 500. What you can see is that $1000 invested in July 1981 would be worth $42,038 in December 2016, if it were invested in the S&P500. It would be worth almost twice as much if invested in the high RQ50. Interestingly, companies who do R&D poorly, the low RQ50, perform worse than companies who do no R&D at all — their returns are one third those of the S&P500. So, it’s not the case that R&D is a recipe for growth. It’s only a recipe for growth in the right hands.
This isn’t a recommendation to invest in the high RQ50. Rather it’s evidence that smart investors will recognize they can earn higher returns by investing in companies with high RQs. This should make them more patient with the R&D investments of those companies.
4. Fending off activist investors. Activist investors play an important role in the market, by reorganizing companies who aren’t fully exploiting their potential. These investors seem to create the most value when they breakup conglomerates, because often these divisions are worth more as standalone companies than they are as part of the conglomerate. Good examples are Altria in 2007 and Time Warner in 2009. The stocks of their collective pieces earned almost double the returns of the S&P 500 over the period after the split. An attractive feature of these breakup plays is they don’t require expertise with the conglomerate’s internal operations, so it’s fairly easy to create value from them.
The concern in more complex reorganizations, particularly those involving R&D is that R&D requires in-depth knowledge of internal operations. A paper I wrote with colleague, Trey Cummings, does a nice job of illustrating that. We examined the RQs of all public companies following the appointment of new CEOs and found that the RQs of companies with outside CEOs declined after their appointment relative to those who promoted from within. This was particularly true if the CEO also came from outside the industry. This implies that effective management of companies that rely on R&D from growth, requires detailed understanding of how that growth engine works.
Because activists lack this expertise, they may destroy R&D capability. A preliminary study supports this concern. Looking first at who activists target, not surprisingly, it’s companies who are ripe for improvement — those who overinvest in R&D, and those with low RQ. By attacking over-investors, activists expect to capture about $258 million of value immediately, merely by cutting R&D. For those with low RQ, activists expect to increase P/E ratios merely by imposing obvious best practices.
The bigger question is what happens after the attack? Not surprisingly, R&D decreases (to correct the overspending). Interestingly, recent research indicates that patenting increases, as do the equity stakes of the CTO. While this suggests activists value innovation, the researchers also found that inventors leave at a higher rate, and that the sale of patents almost doubles. Thus, the increased patenting may merely represent a higher likelihood of filing a patent for any given innovation, in an effort to sell the resulting technology.
This would be a strategy of exploiting existing innovation, rather than generating new innovation. Such a strategy is to be expected, because hedge funds must both invest in and liquidate all their portfolio companies within ten years. The bigger question is whether this exploitation of existing innovation comes at the expense of future innovation. The answer appears to be “yes” — on average, the RQs of companies decrease after being acquired by an activist.
The good news is the prescription for fending off activists is simple: bring your R&D investment closer to optimum and increase your RQ. Of course, we don’t want wholesale decreases in R&D investment. What we want is companies to increase their RQ, so their current investment is optimal. The question is how to do that. This leads to a fifth thing RQ can help with.
5. Continuous measurable improvement of R&D. Since a company’s growth and market value from R&D depend on RQ (on average a 5-point increase in RQ translates into 11% higher 5-year growth), everyone (companies and investors alike) wants RQ to be as high as possible. To achieve that, the first thing to do is make sure you aren’t doing anything obviously wrong. To check that, review the practices in “How Innovation Really Works.” This book is a final report for managers from two National Science Foundation grants linking companies’ R&D practices to their RQs. While you probably think you know all those, the prescriptions in the book tend to overturn prevailing prescriptions about what makes companies more innovative. This is likely why Steven Frielich, former Director of Materials Science at DuPont, said, “This is the best book on innovation I have read … if for no other reason than it is based on data.”
But the practices in the book are what I refer to as “table stakes.” They are obvious things that apply to all companies conducting R&D. The key to increasing RQ beyond that, is to master R&D specific to your technological domains and markets. This requires looking inward. For most companies, simple answers come identifying the practices you employed (or not) in the past when your RQ was higher. You can track your RQ and your practice history over time to see what practices seem to explain higher and/or lower RQ. Once you identify these practices, higher RQ is achieved by reimplementing the high RQ practices and abandoning the low RQ ones.
In addition to this historical diagnosis, another high payoff diagnostic exercise is to compare the RQs across divisions. Often these differ substantially. I’ve seen companies with some divisions in the top third of the RQ spectrum, while others are in the bottom third. By comparing practices of the high RQ divisions to the low RQ divisions, you can identify ones that should be diffused across the company, as well as others that should be abandoned across the company.
Fortuitously, this may happen automatically if you use RQ to establish divisional R&D budgets. In an effort to secure a larger share of the R&D pie, division managers will investigate and implement these practices on their own.
Once you’ve redesigned your R&D practices in this fashion, it’s important to track RQ going forward to ensure it is responding to the changes. Beyond this initial redesign, it’s important to periodically check RQ to ensure it doesn’t inadvertently decline, as it has over recent decades.
Summary
Companies who do R&D are the real engine of economic growth. CEOs, CFOs and investors used to recognize that. Accordingly, they gave CTOs the discretion to set the level and direction of R&D. The world changed with the introduction of financial management. Since that time, CTOs have had to bring a knife to the gunfight for investments — because they didn’t have a good way to demonstrate the returns to their R&D investment. Similarly, they couldn’t compute, nor defend, the optimal level of investment. As a result, R&D fell, ultimately cutting meat in addition to fat, such that companies’ R&D capability has decreased 65% since 1980. This is the reason economic growth is stagnant.
CTOs are the solution to reviving economic growth, because 70% of R&D is conducted within companies — their collective growth comprises economic growth. RQ is an important tool to accomplishing company growth and accordingly economic growth. CTOs can use RQ to: 1.) identify the optimal R&D budget, 2.) compute the ROI for that budget, so they can justify it to CEOs, CFOs and investors, 3.) attract long-horizon investors who grant them discretion to “do the right things,” 4.) fend off short-horizon activist investors, and 5.) continually improve their R&D capability, so they can achieve even higher growth and market value from their R&D.
RQ in essence supports a virtuous cycle in which shrewd investors shift toward high RQ companies, which should cause those companies to further increase their RQ, which should cause even more investors to shift toward high RQ companies. As that cycle repeats, GDP growth should return to mid-20th century levels.
Anne Marie Knott is the Robert and Barbara Frick Professor in Business at the Olin Business School, Washington University in St. Louis, where she has been on faculty since 2005. Prior to that, she was an assistant professor of management at Wharton. Knott is offering a free RQ report to any company willing to complete a 4-question survey about its R&D practices. Please email her at [email protected] for details.


Very interesting. But I don’t see how a company can quickly identify its current RQ because so many other factors affect a company’s net profit over, say, a five year period, even if R&D spending as a % of sales is held constant. Trying different levels of R&D spending over a long time period would likely do it but this makes learning the company’s RQ a very long term project and thus makes not all that helpful.