 A spectrophotometer is an instrument used to determine the chemical composition of a sample by measuring how light at different frequencies passes through it. The spectrophotometer includes a light source to pass light through the sample, and a photodetector to measure the intensity of light passing through the sample.
Most commonly the light is in the ultraviolet, visible, and infrared frequency range. However, spectrophotometers can cover a very wide range of the electromagnetic spectrum from x-rays through to microwaves. In astronomy, a spectrophotometer simply measures the frequency of light from an object in space, without providing its own light source.
Light is absorbed by substances due to the interaction of photons with molecules. The molecules of different substances have a unique set of energy levels resulting from their chemical bonds and nuclei. This causes them to more strongly absorb light at certain frequencies.
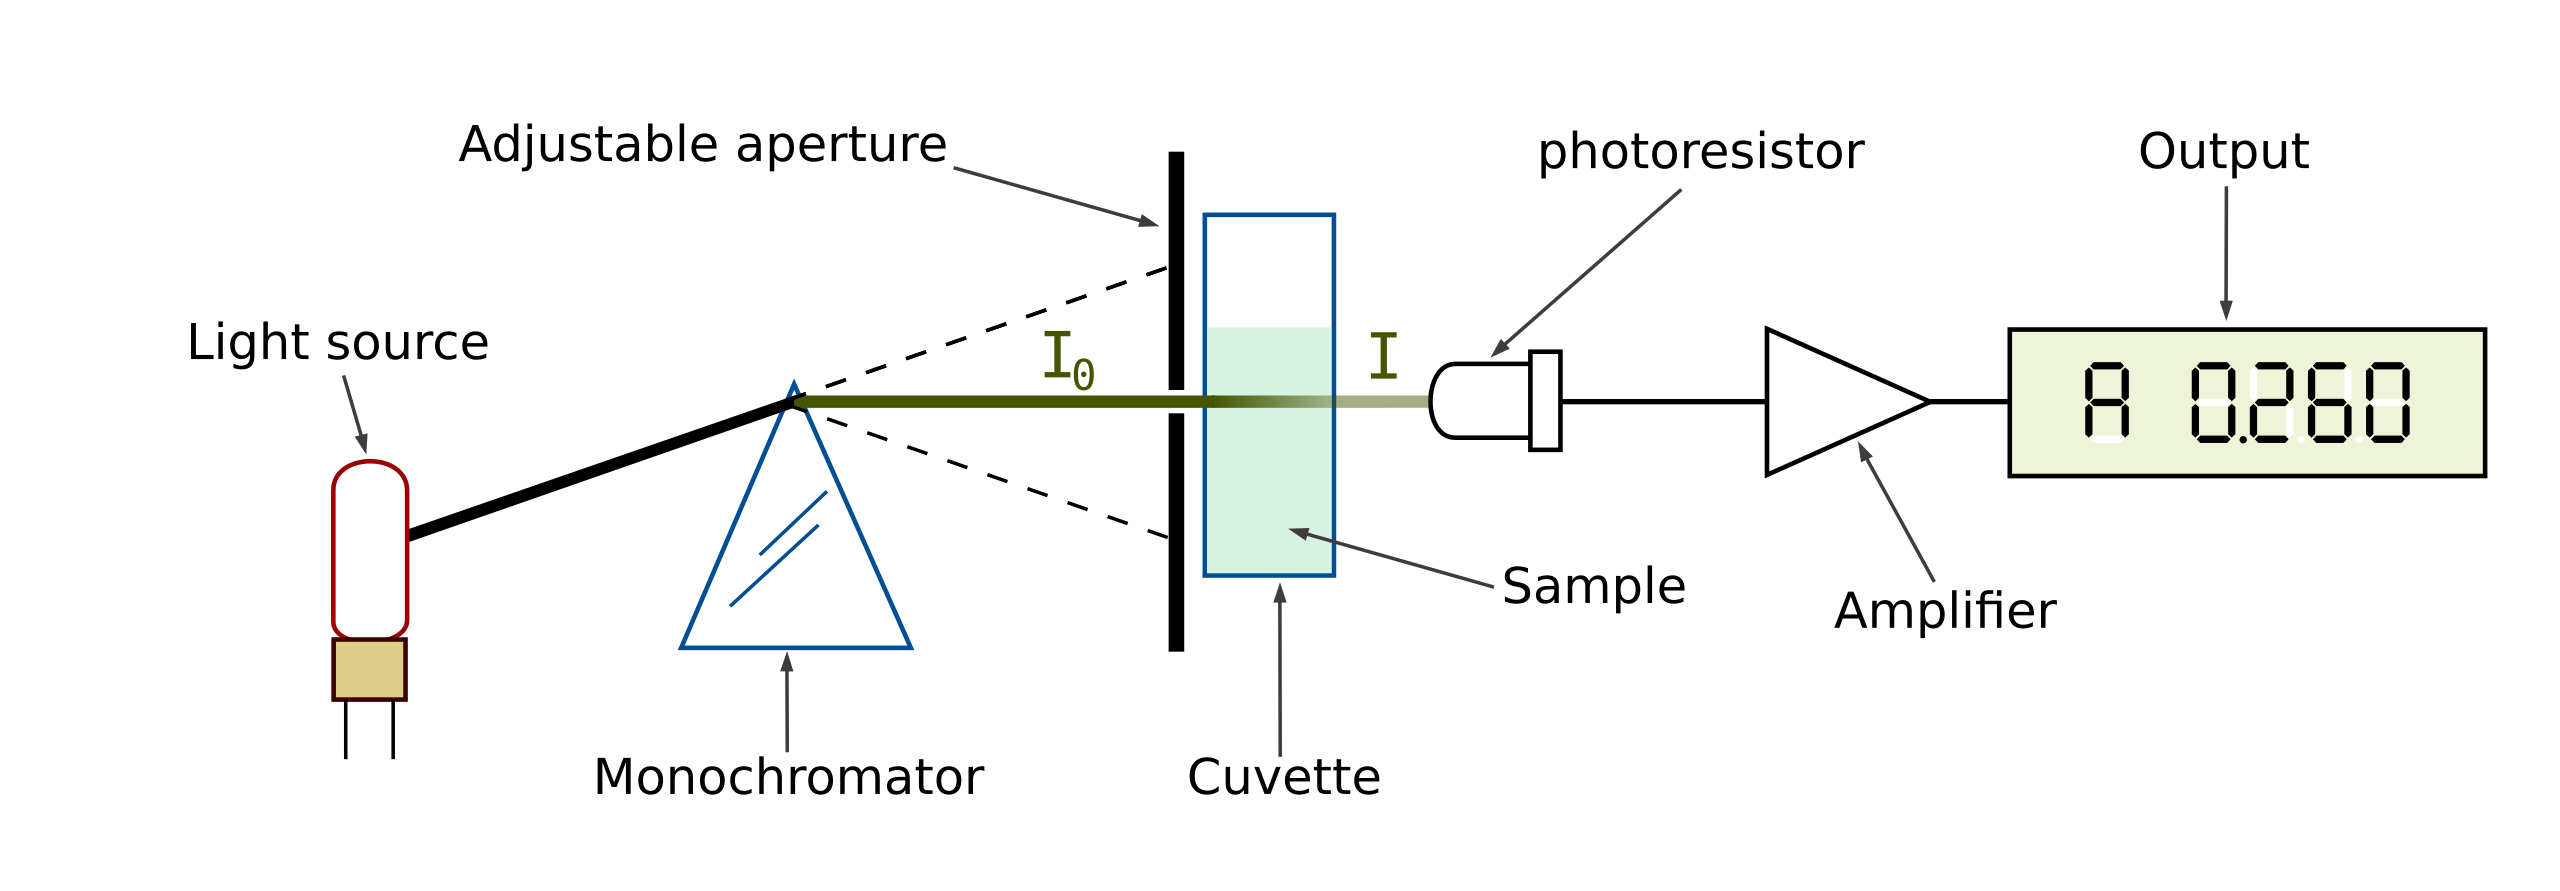 There are two fundamental ways of measuring how light at a specific frequency passes through a sample. Either the light source must produce a narrow frequency range, or the photodetector must measure a narrow frequency range. A tungsten incandescent light bulb is often used to provide a white light source in the visible range. A hydrogen or deuterium arc lamp may be used as a UV light source. A monochromator and diffraction grating may then be used to limit the light source to a narrow frequency range. This can then be mechanically scanned through the frequency ranges of interest. Alternatively, an array of CCDs or photodiodes can be used to measure the different frequencies simultaneously. Fourier transforms are commonly used to identify individual frequency spikes in the results.
Spectrophotometers may use a single beam or a double beam design. A single beam spectrophotometer simply passes light directly through the sample. If the result from the sample needs to be compared with a reference sample, then they are alternately placed in the spectrophotometer. A double beam spectrophotometer splits the beam into two paths after it has been filtered by the monochromator and grating. One beam goes through the sample and the other through a reference material, allowing a direct comparison.
Spectrophotometry is used in many applications including biochemistry, medical diagnostics, environmental monitoring, and quality control in the pharmaceutical and food industries. They are often used to measure the concentration of substances in a solution or to measure the optical quality of transparent solid materials.


Tell Us What You Think!