Value Stream Mapping visualizes how samples and information actually move through the lab, often revealing hidden rework loops, redundant handoffs and wait times. Streamlining these flows can reduce cycle time and free staff for higher-value work.
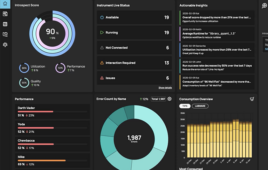
Laboratory Operations (LabOps) now drives scientific value directly. Labs no longer limit the role to basic support tasks, such as stocking reagents and repairing equipment. Heading into 2026, many lab leaders manage high-throughput data pipelines, integrate multi-modal research workflows and comply with stricter regulatory requirements.
Many labs face sharp increases in complexity from handling massive data volumes across instruments like mass spectrometers and sequencers, coordinating multi-disciplinary teams, and meeting stricter regulations on data integrity. Then there is the challenge of integrating these elements: disparate systems create error-prone manual handoffs that slow work and risk compliance failures. One team might track samples via spreadsheets while another pulls results from isolated instrument drives, forcing copy-paste transfers that breed transcription mistakes and lost context.
Reproducibility now carries high stakes. Recent surveys show 72% of biomedical researchers recognize a crisis, with many unable to replicate key studies. The problem wastes resources, erodes trust and invites heavier regulatory oversight in fields like pharma.
The response to that crisis is integration: instrument-linked LIMS that automate data capture and enforce standard procedures, combined with lean mapping to eliminate redundant steps and manual handoffs.
“Labs routinely identify quality metrics at the test panel level, but they can also demonstrate to leadership how quality contributes to expense savings or even cost avoidance,” notes Tammy Germini, a former health system lab director, in a Quest Diagnostics analysis. That shift, from cost center to strategic asset, is reshaping how many lab leaders think about operations.
The digital backbone: Interoperability and data integrity
In high-performance laboratories, data is the most valuable asset. Fragmented spreadsheets and isolated instrument hard drives no longer suffice. Best practice centers on a unified “Digital Backbone” anchored by a cloud-native Laboratory Information Management System (LIMS).
“Fragmented IT systems make the effort to validate financial, quality, and turnaround time data an uphill climb,” Germini observed. The path forward involves integration.
Some labs misunderstand or separate two core tools: Laboratory Information Management Systems (LIMS) and Electronic Lab Notebooks (ELN). Competitive operations now combine them. LIMS tracks structured data: samples, workflows and standard operating procedure enforcement. ELN captures unstructured elements, including experimental notes, hypothesis changes and intellectual property records. Deployed together, they cover the full data lifecycle while maintaining regulatory compliance (GLP/GMP) without constraining discovery.
Eliminating data silos
A “Single Source of Truth” requires aggressive interoperability spanning instrumentation and application program interfaces (APIs):
- Instrument integration: Middleware connects analytical instruments directly to LIMS, automating result capture and eliminating transcription errors. Labs running mass specs, sequencers, and HPLC systems through these links report fewer data entry mistakes and faster result release.
- API-First Architecture: Disparate tools (inventory management, environmental monitoring, scheduling) feed into a central data lake. The payoff: analysts can correlate reagent stock with run volumes, flag temperature excursions affecting samples, or track asset utilization across sites. Those decisions are based on unified data rather than fragmented guesses.
AI/ML as operating infrastructure
Clean, integrated data pipelines unlock a second shift: using that data proactively. Modern LabOps teams are starting to treat AI/ML as part of the operating system rather than an add-on. With instrument data flowing into a LIMS/ELN backbone, labs can deploy predictive analytics to forecast bottlenecks. Such bottlenecks could include anything from sample arrivals, instrument availability and reagent burn rates. The AI and ML systems can then flag drift before it becomes a failure.
On the analytical side, computer vision, a long-standing AI branch, is moving deeper into production: automated image analysis can quantify cell confluence, count colonies, score assay plates, or triage microscopy backlogs with consistent rules and audit trails. The practical win is fewer repeats, faster cycle times, and more reproducible decisions.
Process optimization
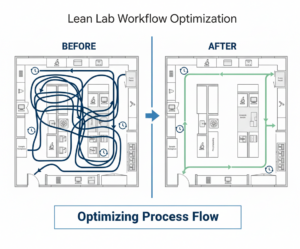
Before adding automation or analytics, labs benefit from examining whether their workflows make sense in the first place. Lean Six Sigma, adapted from manufacturing, provides the toolkit.
Value Stream Mapping visualizes sample and information flow through the lab, documenting every step from receipt to result release and measuring both processing time and wait time at each stage. The exercise typically exposes what Lean practitioners call the “hidden factory“: rework loops, approval bottlenecks and redundant quality checks that consume resources without adding value.
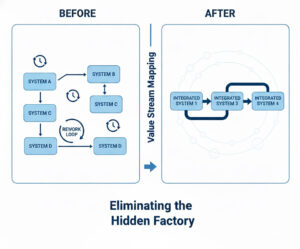
The “hidden factory” refers to invisible waste embedded in lab workflows: rework loops, wait times between systems, and redundant handoffs that consume resources without adding value. Value Stream Mapping exposes these inefficiencies so teams can redesign around integrated, continuous flow.
A 2013 cytopathology study used VSM to analyze Pap test processing and found that traditional batching of 80 specimens created substantial non-value-added wait time. The first accessioned specimen sat idle while staff processed the remaining 79. Reducing batch size to 40 and parallelizing tasks between staff members cut processing time while reducing accessioning and labeling errors.
A tertiary care laboratory in Mumbai applied VSM to its pre-analytical workflow and identified six non-value-added steps that collectively added 55 minutes per batch. After integrating chemistry and immunology analyzers with a central specimen receiving station, turnaround time compliance improved by 41% for biochemistry assays. The lab also saved 43,800 human-hours annually and recovered 100 square feet of floor space.
DMAIC in practice
The Six Sigma component adds statistical rigor through the Define, Measure, Analyze, Improve, Control (DMAIC) framework. A Turkish clinical laboratory study applied DMAIC to stat sample processing. Baseline measurement showed turnaround time averaging 68 minutes. Root cause analysis identified specific bottlenecks in the reception area, where staff performed tasks prone to transcription errors. After targeted interventions, stat turnaround time (TAT) reportedly dropped to 59 minutes from 68. In addition, steps posing biological hazards fell from 30% to 3%, and improvements held through three years of follow-up monitoring.
Another case report details a pharmaceutical QC laboratory that used DMAIC to reduce cycle time. Pareto analysis revealed that 85-95% of workload came from just three product families, and that one test consumed disproportionate analyst time due to a policy of testing every sample daily regardless of volume. Restructuring the testing schedule and approval workflow cut average cycle time from 14.8 days to 8 days, with 100% of samples meeting the new 10-day target versus 66% meeting the old 15-day target.
Kaizen events
Kaizen events concentrate improvement work into short bursts, typically 3-5 days, where cross-functional teams observe actual workflows and implement fixes on the spot. The Washington State crime lab applied this approach to DNA testing. According to a Harvard DataSmart case study, the Kaizen-driven process yielded 20% faster processing, a 10% backlog reduction, and 56% lower staff overtime without purchasing new equipment. The key was updating SOPs immediately after each event and reinforcing changes through sustained management follow-up.
Automation: Cobots and mobile robotics
Automation used to mean high-throughput screening centers with six-figure capital budgets. That’s no longer the case. Smaller labs are deploying cobots and mobile robots to address reproducibility problems, reduce repetitive strain injuries, and retain staff who would rather analyze results than cap tubes.
Cobots differ from traditional industrial robots in one key respect: they can work alongside humans without safety cages. Force-limiting actuators and collision detection allow them to share bench space with technicians.
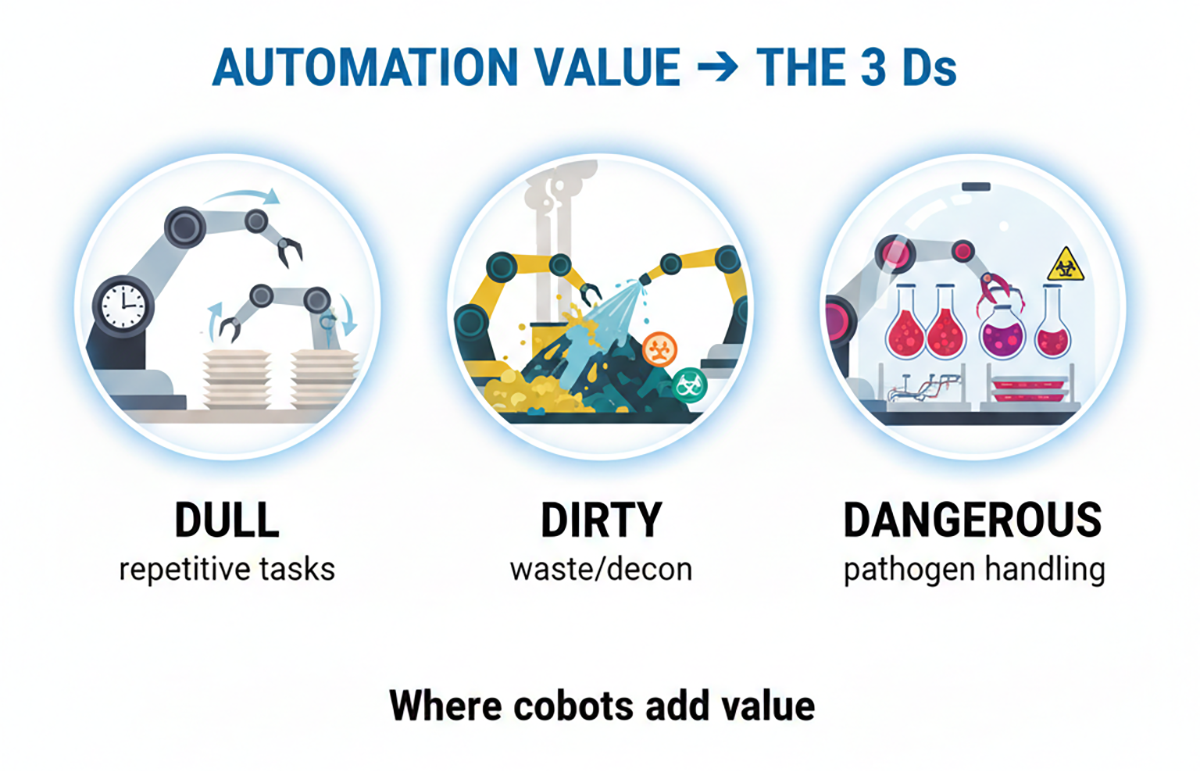
The practical applications tend to cluster around what practitioners call the “3 Ds”: tasks that are Dull (repetitive capping/decapping, plate loading), Dirty (waste handling, decontamination), or Dangerous (pathogen exposure, hazardous chemical handling).
The ergonomic case alone is worth paying attention to. According to data from INTEGRA Biosciences, nearly 90% of scientists who pipette for more than an hour daily report hand and elbow disorders, with additional complaints involving wrists, shoulders and necks. A proof-of-concept study on semi-automated tuberculosis testing demonstrated that shifting sample handling to robotic systems reduced both exposure to infectious specimens and repetitive strain risk while maintaining workflow throughput.
Copenhagen University Hospital’s clinical laboratory at Gentofte offers a documented example of cobot deployment at scale. The facility integrated UR5e cobots into blood sample processing, handling tasks like centrifuge loading and tube sorting that previously consumed technician time. According to a Universal Robots case study, the lab maintained over 90% of clinical biochemistry results within one hour despite a 20% increase in sample volume. The automation absorbed demand growth without proportional staffing increases.
Cobots excel at tasks humans would rather avoid: repetitive motions that cause strain injuries, waste handling and decontamination, and work involving pathogen exposure or hazardous chemicals. Automating the “3 Ds” frees skilled staff for analytical work while improving safety and reproducibility.
Autonomous Mobile Robots (AMRs)
In larger facilities, the logistics problem compounds ergonomics. A survey of hospitals in the US, Canada, and Germany found that non-nursing tasks like delivery and retrieval consume roughly 40% of nurses’ working time. Laboratory staff face similar burdens: transporting samples from collection points to processing stations, moving plates between instruments and shuttling reagents from storage.
Unlike older automated guided vehicles that follow fixed paths, AMRs navigate dynamically around obstacles and people. They can integrate with LIMS to receive task assignments and confirm deliveries. A 2025 validation study deployed the HOSBOT AMR platform in a tertiary hospital for biological sample transport over two weeks, confirming that the system could handle clinical specimen logistics while meeting contamination control requirements with standard disinfection protocols.
The operational model shifts from batch-and-queue (collect samples, wait for courier, deliver in bulk) to continuous flow (AMR picks up samples as they’re ready). For labs processing time-sensitive specimens, the difference matters: faster sample-to-result times without adding headcount to handle peak loads.
Asset lifecycle: From acquisition to decommissioning
Personnel costs dominate most laboratory budgets. Industry surveys show they account for 40-60% of operating expenses in research and clinical labs, driven by salaries, benefits and training for skilled staff.
Equipment often ranks next: high initial purchase prices for instruments like mass spectrometers or sequencers, plus ongoing service contracts that typically run 5-10% of asset value annually. Consumables follow closely, with reagents and disposables reaching 25-30% of costs in high-throughput settings.
Labs lose money with “buy and forget” habits. They purchase assets without tracking utilization (many instruments sit idle 50%+ of the time), face unexpected breakdowns that halt work, overpay on reactive repairs and incur high decommissioning or disposal fees for hazardous materials.