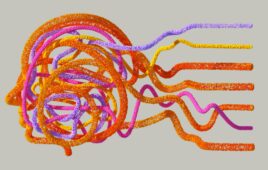
Visualization of data fragmentation in biopharma. Image generated using OpenAI’s image generation technology.
In cosmology, invisible dark matter outweighs ordinary matter by roughly six to one. Drug discovery faces a similar imbalance: “dark data” marooned in lab systems. A bottom-up audit by scientific data and AI firm TetraScience estimated “greater than 10 million” discrete silos scattered across biopharma, everything from aging electronic lab notebooks and lone-wolf LIMS databases to mismatched instrument files and IoT readouts. Inside a single top-25 drugmaker, the average count could easily be in the ballpark of 150,000, according to the firm’s analysis.
What drives disconnected data streams in biopharma
Ken Fountain, vice president of scientific applications at TetraScience, explains how this eye-popping number arises. He points first to the sheer scale within large organizations: “If you look at the whole enterprise, you’re talking about an average of 8,000 to 9,000 instruments per large, top-100 pharma. Then you’ve probably got 2,000 to 5,000 R&D scientists using those… instruments. Multiply just those two figures and you’re easily into the millions of data silos.” Compounding this are workflow issues, like non-networked instruments requiring manual data entry into multiple systems like spreadsheets or ELNs. “You can see how that number quickly explodes,” Fountain noted. It’s this “multiplicative nature,” he said, spanning different data formats, geographical sites, labs, departments, and technology vendors, that drives the total count “well north of 10 million scientific silos” across biopharma.

Ken Fountain
This labyrinth of disconnected data creates what Naveen Kondapalli, TetraScience’s head of engineering and platform product, calls a “big scientific data utility gap.” While a wealth of data is theoretically available, little of it tends to be readily usable for advanced analytics. “Somebody has to do the work to connect it to the outcomes,” Kondapalli explained. This fundamental usability issue forces data scientists into laborious, non-scientific tasks. The old adage about data scientists spending between 60% and 80% of their time prepping data still holds, according to Ken Fountain III, vice president of scientific applications at TetraScience.
Mind the (data utility) gap
“Roughly 50% of a scientist’s time today, on average, is is spent aggregating and transcribing data manually from one place to the other,” Fountain said. Scientists are “pasting whatever operation they want to to insert, and that means it’s 50% of their time not thinking about the scientific problem.” The inefficiency stems from a nested maze of silos: one at the company level, another at each site, then down to departments and individual labs. Within these layers lie hundreds of thousands of instruments, diverse software from ELNs to LIMS, and their respective vendors. Add external partners like CROs, CDMOs, and CMOs involved across the R&D-to-manufacturing chain, and the multiplication spirals.
This complex web of silos directly obstruct larger strategic goals. “If you want to realize your AI or do analytics on top of the data, there’s a big scientific data utility gap,” Kondapalli explained.
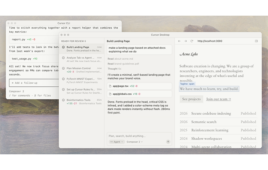
![[Image from TetraScience]](https://www.rdworldonline.com/wp-content/uploads/2025/05/data_utility_gap.webp)
Millions of raw, unstructured data silos in biopharma hinder the use of analytics and AI, which require large-scale, integrated, and well-engineered data. [Image from TetraScience]
Step one: Untangle the mess with cloud help
Tackling this utility gap requires foundational work, starting with what TetraScience calls data replatforming. “We are replatforming the data into the cloud,” Kondapalli said. “All this data in different formats, different contexts, different locations [is] normalized. While this initial move primarily addresses data access rather than structure, it creates a crucial single point of entry.

Naveen Kondapalli
Kondapalli compares the approach to what Palantir did for defense intelligence two decades ago: standardize messy data, wrap it in an ontology and open it up to analysts.
The next step is data engineering, focused on harmonizing the information itself. “We are harmonizing the data,” Kondapalli said. “Irrespective of the source or format, once it goes through this step, it all becomes standard schemas.”
Turning data Babel into one language
Kondapalli offered the example of a plate reader: “There is a schema for a plate reader, which has the wells and different components… in a very standardized format,” he noted. This ensures that whether the instrument comes from Vendor A or Vendor Z, the resulting data conforms to the same standard structure. Ontologies then group these schemas by workflow; for instance, “for bioprocess… we have an ontology which represents a collection of the schemas,” Kondapalli explained. These ontologies provide downstream apps and AI models with a consistent, ready-made map to the data.
Once the data universe collapses into one queryable layer, quick wins tend to surface fast. Need an audit-ready compliance snapshot? Now a few SQL lines deliver it. A user can now think: “Show me a compliance dashboard for all the data coming from these silos,” Kondapalli said.
Because every assay and instrument now lands in the same schema, data generated today can “provide a future look into use cases that the industry might not know about yet,” Fountain said.
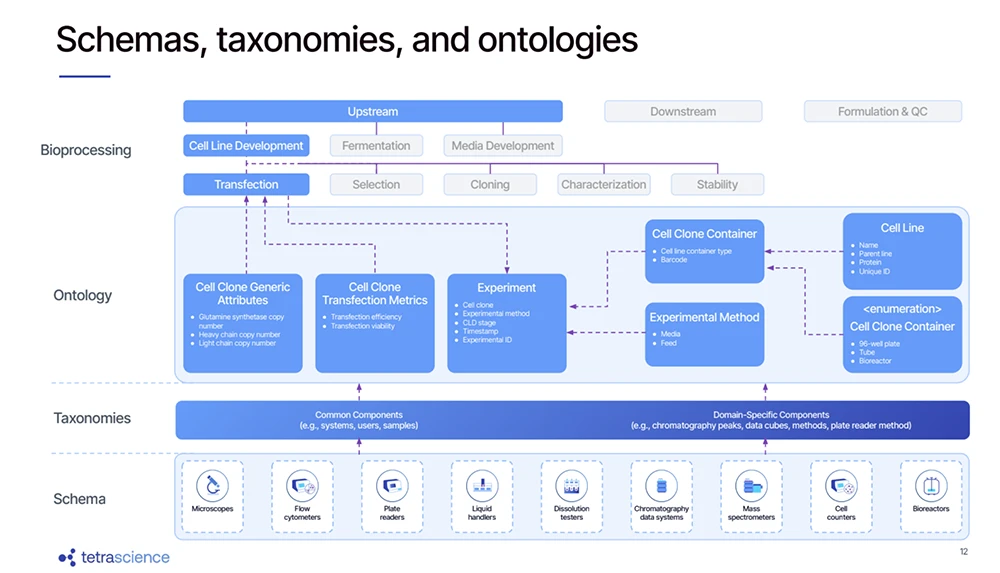
TetraScience uses schemas (standardizing instrument data), taxonomies (grouping components), and ontologies (mapping workflows like bioprocessing) to harmonize data. [Image from TetraScience]
Day-to-day drudgery improves, too. “Bringing data from an instrument to a lab notebook … can be done very quickly once that data is replatformed and engineered,” Fountain added. Translation: fewer copy-paste marathons, more actual science.