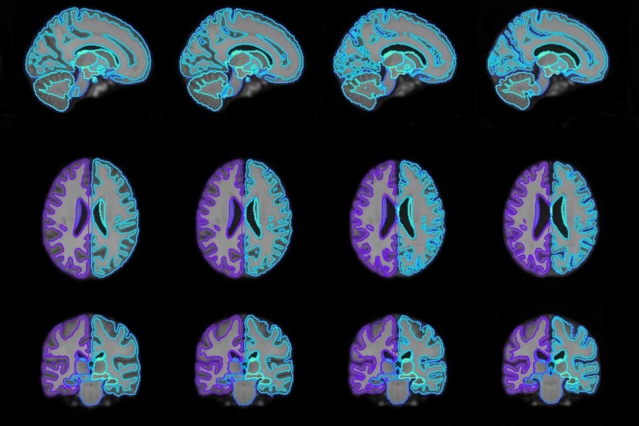
With their model, researchers were able to generate on-demand brain scan templates of various ages (pictured) that can be used in medical-image analysis to guide disease diagnosis.
Image courtesy of the researchers
MIT researchers have devised a method that accelerates the process for creating and customizing templates used in medical-image analysis, to guide disease diagnosis.
One use of medical image analysis is to crunch datasets of patients’ medical images and capture structural relationships that may indicate the progression of diseases. In many cases, analysis requires use of a common image template, called an “atlas,” that’s an average representation of a given patient population. Atlases serve as a reference for comparison, for example to identify clinically significant changes in brain structures over time.
Building a template is a time-consuming, laborious process, often taking days or weeks to generate, especially when using 3D brain scans. To save time, researchers often download publicly available atlases previously generated by research groups. But those don’t fully capture the diversity of individual datasets or specific subpopulations, such as those with new diseases or from young children. Ultimately, the atlas can’t be smoothly mapped onto outlier images, producing poor results.
In a paper being presented at the Conference on Neural Information Processing Systems in December, the researchers describe an automated machine-learning model that generates “conditional” atlases based on specific patient attributes, such as age, sex, and disease. By leveraging shared information from across an entire dataset, the model can also synthesize atlases from patient subpopulations that may be completely missing in the dataset.
“The world needs more atlases,” says first author Adrian Dalca, a former postdoc in the Computer Science and Artificial Intelligence Laboratory (CSAIL) and now a faculty member in radiology at Harvard Medical School and Massachusetts General Hospital. “Atlases are central to many medical image analyses. This method can build a lot more of them and build conditional ones as well.”
Joining Dalca on the paper are Marianne Rakic, a visiting researcher in CSAIL; John Guttag, the Dugald C. Jackson Professor of Computer Science and Electrical Engineering and head of CSAIL’s Data Driven Inference Group; and Mert R. Sabuncu of Cornell University.
Simultaneous alignment and atlases
Traditional atlas-building methods run lengthy, iterative optimization processes on all images in a dataset. They align, say, all 3D brain scans to an initial (often blurry) atlas, and compute a new average image from the aligned scans. They repeat this iterative process for all images. This computes a final atlas that minimizes the extent to which all scans in the dataset must deform to match the atlas. Doing this process for patient subpopulations can be complex and imprecise if there isn’t enough data available.
Mapping an atlas to a new scan generates a “deformation field,” which characterizes the differences between the two images. This captures structural variations, which can then be further analyzed. In brain scans, for instance, structural variations can be due to tissue degeneration at different stages of a disease.
In previous work, Dalca and other researchers developed a neural network to rapidly align these images. In part, that helped speed up the traditional atlas-building process. “We said, ‘Why can’t we build conditional atlases while learning to align images at the same time?’” Dalca says.
To do so, the researchers combined two neural networks: One network automatically learns an atlas at each iteration, and another — adapted from the previous research — simultaneously aligns that atlas to images in a dataset.
In training, the joint network is fed a random image from a dataset encoded with desired patient attributes. From that, it estimates an attribute-conditional atlas. The second network aligns the estimated atlas with the input image and generates a deformation field.
The deformation field generated for each image pair is used to train a “loss function,” a component of machine-learning models that helps minimize deviations from a given value. In this case, the function specifically learns to minimize distances between the learned atlas and each image. The network continuously refines the atlas to smoothly align to any given image across the dataset.
On-demand atlases
The end result is a function that’s learned how specific attributes, such as age, correlate to structural variations across all images in a dataset. By plugging new patient attributes into the function, it leverages all learned information across the dataset to synthesize an on-demand atlas — even if that attribute data is missing or scarce in the dataset.
Say someone wants a brain scan atlas for a 45-year-old female patient from a dataset with information from patients aged 30 to 90, but with little data for women aged 40 to 50. The function will analyze patterns of how the brain changes between the ages of 30 to 90 and incorporate what little data exists for that age and sex. Then, it will produce the most representative atlas for females of the desired age. In their paper, the researchers verified the function by generating conditional templates for various age groups from 15 to 90.
The researchers hope clinicians can use the model to build their own atlases quickly from their own, potentially small datasets. Dalca is now collaborating with researchers at Massachusetts General Hospital, for instance, to harness a dataset of pediatric brain scans to generate conditional atlases for younger children, which are hard to come by.
A big dream is to build one function that can generate conditional atlases for any subpopulation, spanning birth to 90 years old. Researchers could log into a webpage, input an age, sex, diseases, and other parameters, and get an on-demand conditional atlas. “That would be wonderful, because everyone can refer to this one function as a single universal atlas reference,” Dalca says.
Another potential application beyond medical imaging is athletic training. Someone could train the function to generate an atlas for, say, a tennis player’s serve motion. The player could then compare new serves against the atlas to see exactly where they kept proper form or where things went wrong.
“If you watch sports, it’s usually commenters saying they noticed if someone’s form was off from one time compared to another,” Dalca says. “But you can imagine that it could be much more quantitative than that.”
Written by Rob Matheson, MIT News Office

Patterns, in nature, occur in fractal fashion. It would be useful to you to examine the “brain structure” in terms of fractals and find the variation for “that structure” within an individuals fractal class….based upon their own fractal expression and in relationship to their genetic/geographic grouping….. Distance between ” “, depth of ” “, degree of arc of ” ‘, size in relationship to ” ‘, and so on….. If you were going to define a brain as a relationship to it’s parts….. much as a seed is a tree or a grass, the structure of it’s future is predetermined by it’s relationship to it’s parts/starting supplies/soil/moisture/weather…..a fractal number could be used to define a seed…a brain….a condensation of it’s relationships….a sound…a tone… and variations that would be nutritional, or ….
At some point this would observation would occur after a certain number of iterations of study were examined and the algorithm synthesized by extraction from the images…..
Why wait?
That would give you the ability to find the fraying of the fractal pattern leading to dysfunction. Regularity is health.