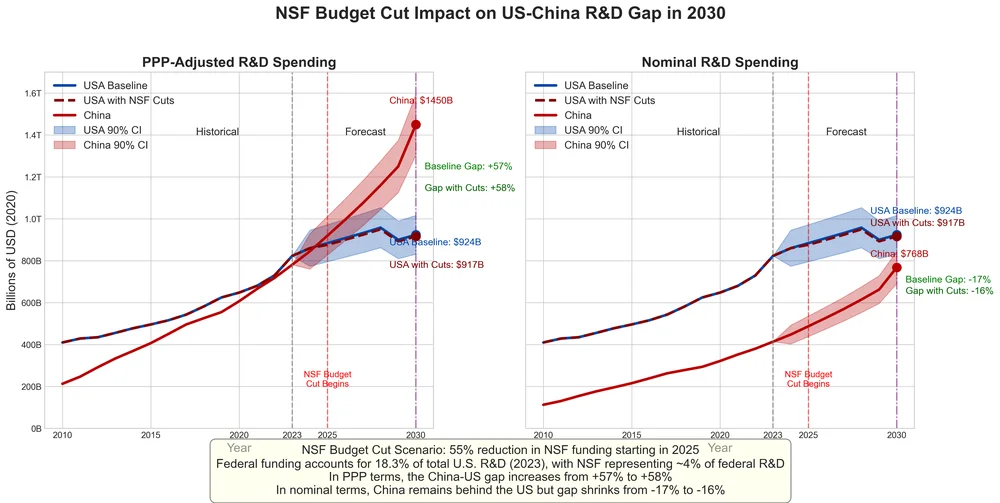
U.S. dollar values, PPP‑adjusted (2020 base). The U.S. dip beginning in circa FY2027 tracks the scheduled sunset of the CHIPS Act, legislation (which Trump says he will repeal) and the effect of proposed 55% cuts to the National Science Foundation budget.
Run the numbers 1,000 ways, and the outcome never flips: China overtakes the United States on PPP-adjusted R&D spending well before 2030. Our 1,000-run Monte Carlo model, seeded with OECD and World Bank data, puts the narrowest gap at 30%, the median at 58% when considering recent cuts to the National Science Foundation. Tariff hikes, CHIPS-Act freezes or an unexpected trade truce nudge the curve but never change the ranking. In the middle lane China’s 2030 bill reaches about $1.45 trillion. America’s spending lands at roughly $864 billion (down from $924 billion in our baseline scenario without NSF cuts), which equates to a $586 billion spread. That spread alone is larger than Germany’s entire research budget, which was estimated at roughly $132 billion to $154 billion PPP in recent years.
For the sake of comparison, even the 30% conservative figure is more pronounced than earlier baseline projections. Feeding data from other projections into our Monte Carlo approach while harmonizing everything to 2020 PPP dollars leads to a spread of roughly 9% to 19% spread depending on the model. Why is that? Because those earlier baselines use pre‑2023 inputs and older PPP deflators while assuming steadier U.S. growth. Even when omitting tariff shocks and exploring a range of CHIPS Act scenarios, the projected gap at 2030 looks broadly similar.
[Note: Updated on April 25 with NSF historical data and modeling of proposed 55% NSF budget cut impacts. Analysis now incorporates declining federal R&D share (18.3% as of 2023, decreasing 3.9% annually)]
Shifting fortunes
China’s all but drawn even. Now what?

[Image sources: Adobe Stock]
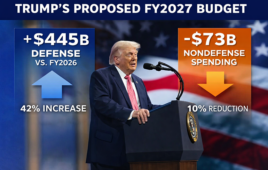
U.S. public research faces significant drag. FY2025 House drafts hold NSF at more than 40% below CHIPS authorizations, and insiders warn of potential 25% to 50% staff cuts. NSF’s new-grant count is already down 50% compared to a year ago, according to Science magazine. President Trump’s March 4 joint-session speech urged Congress to “get rid of the CHIPS Act.” Analysts note repeal is unlikely, but even a funding freeze would widen China’s lead.
In the worst-case path the gap balloons to 95%. That number sits on the far rim of the fan chart. Five of our 1,000 simulations land there. All five share the same recipe: China keeps double-digit real growth, U.S. grant freezes drag on, and tariff shocks shave another slice off corporate R&D. Rather than inventing new variance, the model here simply lets those low-probability combinations play out. Even the “floor” run still leaves China one-third ahead, but the tail reminds us how wide the spread could grow if every break goes Beijing’s way.
U.S. giants still unmatched in terms of scale
While China is on a path to become the biggest R&D spender once you adjust for purchasing power, the largest corporate R&D checks still come from the West. Even China’s biggest private lab, Huawei invested roughly $23 billion in 2023, which equates to less than half of Amazon’s estimated $59.8 billion (its broader technology and content expenses for 2023 were $76.9 billion) and about half of Alphabet’s $48.4 billion (FY 2023).
The corporate picture is even more lopsided than the country totals. The 2024 EU Industrial R&D Investment Scoreboard lists 681 U.S. companies among the world’s 2,000 biggest investors and 524 from China, but the cash is stacked at opposite ends of the table, according to the EU Scoreboard. Twenty‑three of the 30 largest R&D check‑writers are American—Amazon ($85.6 billion), Alphabet ($45.4 billion) and Merck ($30.5 billion) lead the pack—while China manages just one entry, Huawei at No. 8 with about $23 billion, per R&D World’s coverage. Tencent, the next Chinese name, spent roughly $10 billion, good for the mid‑30s on the same list, according to Reuters.
In other words, U.S. fire‑power sits in a handful of tech‑ and pharma‑heavy giants, whereas Beijing’s muscle is spread across a swelling cohort of mid‑sized hardware, auto and clean‑energy players bracketed just below the top tier, according to the EU Scoreboard. That long tail is growing faster, too: Chinese firms outside the global top 50 lifted real R&D outlays about 10% last year, versus roughly 6% for their U.S. peers, according to the EU Scoreboard. If that cadence holds, the head‑count gap at the very top will narrow even as China’s broader base continues to thicken.
Headwinds on both sides of the Pacific
Beyond 2030, not everyone is convinced China can keep the throttle wide-open. Science | Business points out that “a faltering Chinese economy and plummeting birth-rates have driven a conversation over whether the world has reached ‘peak China,'” a debate now spilling into R&D as well. The U.S. National Intelligence Council’s Global Trends 2040 report similarly acknowledges that China’s long-term growth could moderate, pointing to the international system growing “more contested” while Beijing continues to confront demographic and debt headwinds. Conversely, the U.S. is hardly demographically bullet-proof. The U.S. population is aging and the government intends to clamp down on immigration. On the first day of his new term, President Trump signed the “Securing Our Borders” order, reviving “Remain in Mexico” and instructing DHS to end most categorical parole programs. Choosing to throttle immigration like this means fewer future workers just as the Census Bureau projects that one-fifth of Americans will be over 65 by 2030 and the CDC pegs the fertility rate at around 1.62 — well below replacement. In short, both superpowers face shrinking talent pools; China’s comes from its one-child past, the U.S. from choosing to throttle immigration even as births slump.
Why the gap matters
U.S. headline still looks big—but the federal core is shrinking. Corporate labs are on pace to push total U.S. R&D close to *$1 trillion in 2025* (building from $886 billion in 2022 according to PPI and projecting to $1.2 trillion by 2027 in *R&D World’s* forecast). Yet federal science is being squeezed: the Trump administration has frozen new NSF awards, NSF’s new-grant count is down 50% versus a year ago, according to *Science*, and a draft 2026 budget floats a 40% cut to NIH, as *Science* noted separately. Federal GERD has slipped to 0.55% of GDP—its lowest share since the 1950s.
Our earlier simulation shows proposed tariff hikes could chop roughly –30% off auto R&D in the first year and push semiconductor research budgets into double-digit decline, as an *R&D World* model found. Meanwhile, Beijing logged ¥3.6 trillion (≈ $500 billion, PPP 2020) in 2024 R&D, representing +8% year-on-year growth, and filed a record 70,160 Patent Cooperation Treaty (PCT) patent applications, according to WIPO. The latest OECD release shows China’s public-sector research spend is already 1.6 times the U.S. level and still climbing while U.S. public outlays contract, wrote OECD.
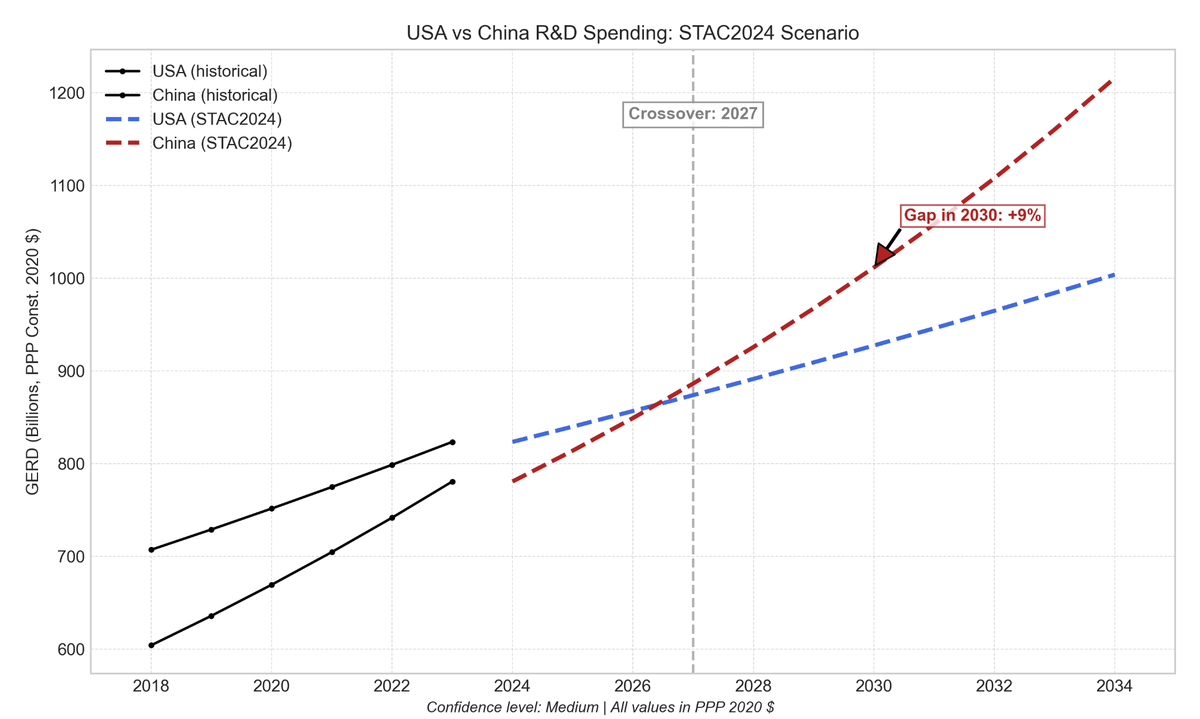
Conservative path. Tracks the Science & Technology Action Committee’s 2024 memo (≈ 7 % real CN growth tapering to 6 %; steady 3 % US). Crossover appears in 2027 and delivers a +9 % China lead in 2030 (PPP 2020 $). Note: The dashed line doesn’t precisely intersect the crossover because it is positioned at the start of the nearest year
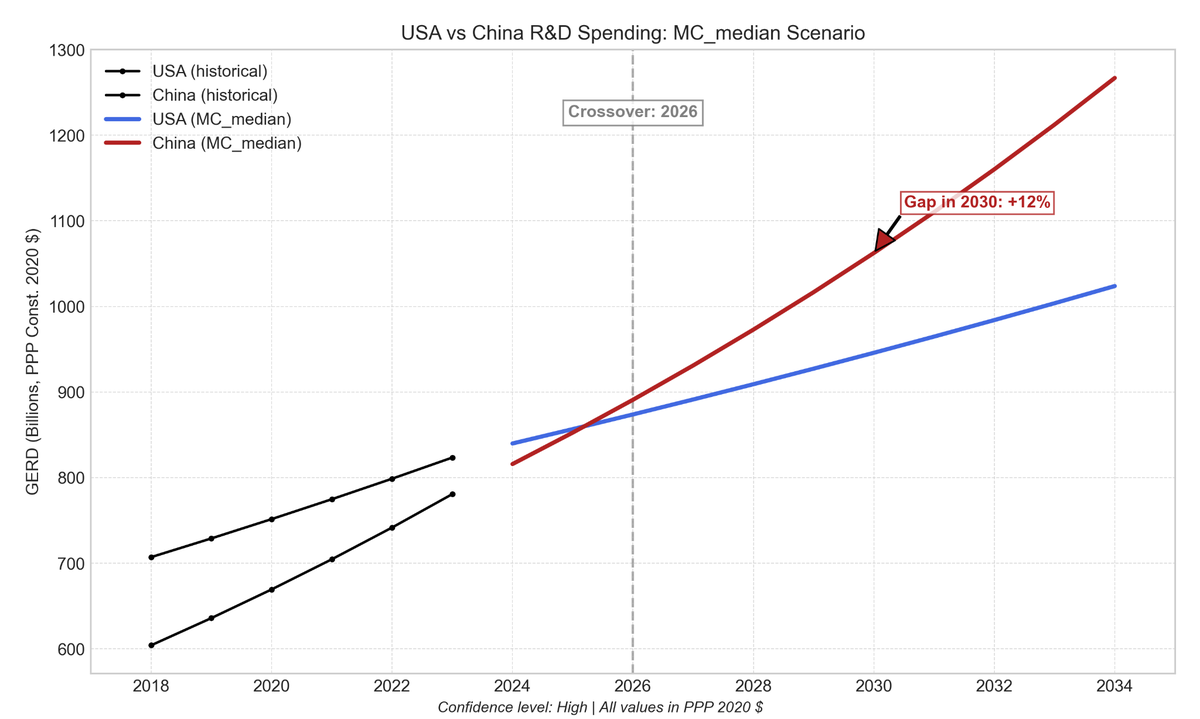
Monte‑Carlo median branch. Median of 1,000 VARX simulation runs (includes tariff noise and CHIPS ramp‑and‑fade). China passes the US in 2026; the central estimate for 2030 is +12 %. Note: The dashed line doesn’t precisely intersect the crossover because it is positioned at the start of the nearest year
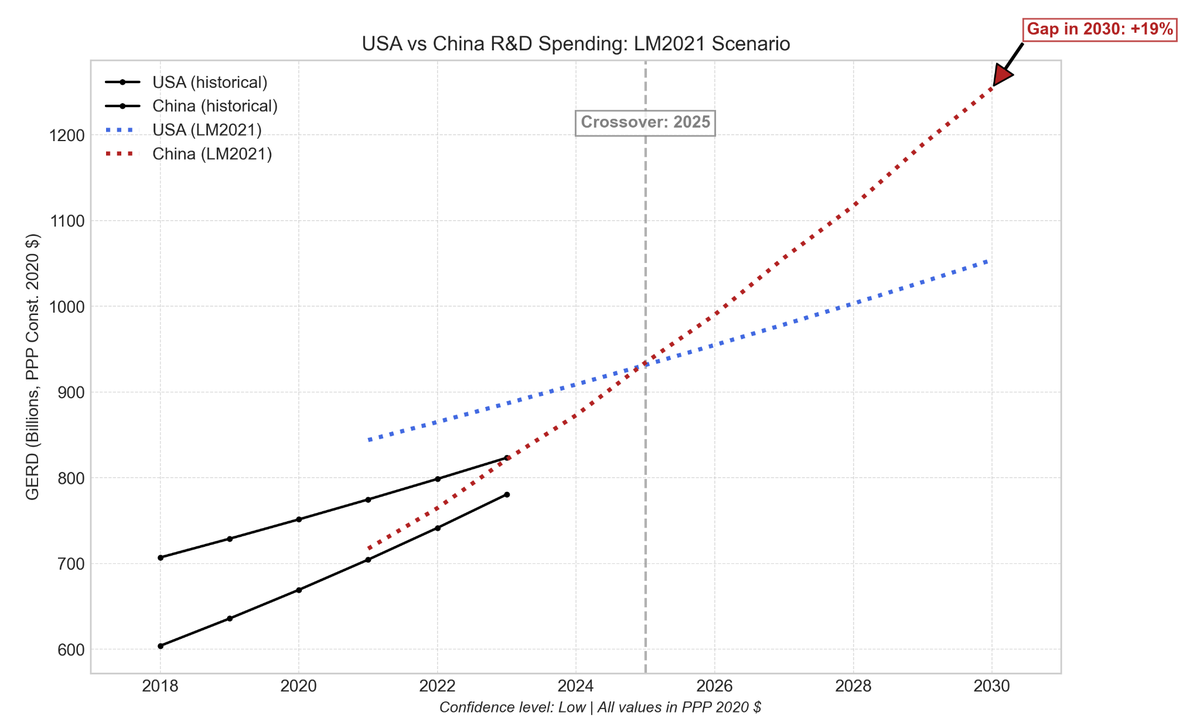
“Le Monde 2021” fast‑growth reprise. Replicates the 2021 Le Monde / R. Duncan projection (approximately 10 % nominal CN CAGR; 3 % US). Shows a +19 % gap by 2030 and an earlier 2025 crossover.
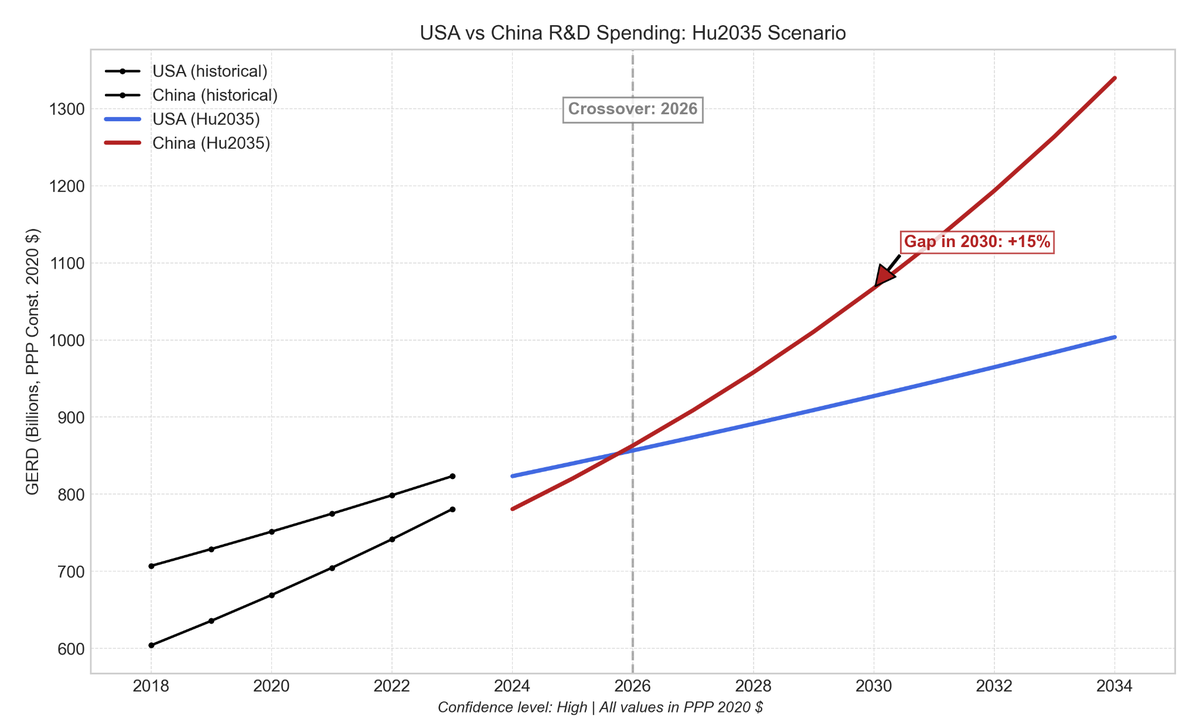
Hu 2035 straight‑line to the 1.78× target. Imposes Angang Hu’s 7.3 % real CAGR for China (with 3 % US) to hit his 2035 1.78× ratio. Line‑draw gap is +15 % in 2030 (roughly +46 % on a ratio basis); crossover in 2026.
Comparisons of other projections at a glance
| Source | Key projections & methodology | Time period | Notes / currency base |
|---|---|---|---|
| Battelle–R&D World Global R&D Funding Forecast (2014) | Projection extrapolates recent growth trends from a 2013 baseline, using normalized (PPP) data for comparison. The document lists data sources (IMF, World Bank, OECD, surveys etc.) and mentions using IMPLAN for economic impact analysis | 2014–2030 | Converted here to 2020 PPP $ for comparability. |
| R&D World Forecast – 2018 edition | PPP‑based trend chart; projects China to overtake the U.S. “by mid‑2026 or sooner,” with China’s annual increase ≥ 3× the U.S.; methodology described qualitatively. The report notes that it bases its “R&D forecasts for each country on economic forecasts and science and technology (S&T) survey data by the International Monetary Fund (IMF), the World Bank, the Organization for Economic Cooperation and Development (OECD), and the U.S. Central Intelligence Agency, along with multiple reader surveys.” | primarily 2016–2018 | Published in PPP; crossover mid‑decade. |
| R&D World Forecast – 2019 edition | PPP-based projection extrapolating trends; projects crossover ‘no later than 2024,’ implying average growth rates differing significantly between China and the U.S.; specific long-term model assumptions not published. | primarily 2017–2019 | Nominal $; assumes listed CAGRs. |
| R&D World Forecast – 2020 edition | Updates the PPP-based trend; projects crossover ‘no later than 2025,’ with the China/U.S. R&D spending ratio reaching about 0.925 in the 2020 forecast; underlying long-term projection model not disclosed. | primarily 2018–2020 | Nominal $; ± 0.5 pp variance noted. |
| R&D World Forecast – 2021 edition | Forecasts China overtaking the U.S. in 2021 (PPP basis), reflecting ~8.2% Chinese vs. ~3.2% U.S. growth from 2020 estimates. The report notes the COVID-19 pandemic accelerated this crossover timeframe; specific model methodology not detailed. | primarily 2019–2021 | First explicit nominal crossover in series. |
| R&D World Forecast – 2022 edition | Provides a 2022 forecast of GERD on a PPP basis, with the United States at $679 billion still leading China at $551 billion, though China’s share is growing. The forecast does not extend to 2030 or describe its methodology. | primarily 2020 to 2022 | Nominal $; details 2022 funding mix. |
| R&D World Forecast – 2024 edition | 2024 R&D World Funding Forecast does not appear to make an explicit prediction about the year China’s R&D spending will surpass the U.S. It presents the current forecast data showing the U.S. lead in 2024 and acknowledges the ongoing competitive trend and China’s rapid growth in areas like patenting | 2022–2024 | Primarily a forecast for 2024 |
| American Academy “Perils of Complacency” (2020) | Shows U.S. vs. China R&D investment (billions of constant 2020 USD) using OECD PPP data. Contrasts China’s spending based on the OECD’s latest 2020 PPP factors with estimates using earlier factors. The update widens the 2018 gap; no new future projection based on the latest data is provided. | 2020–2030 | OECD PPP basis; rebased here to 2020 PPP. |
| Le Monde op‑ed (2021) | Ratio narrative: asserts China could outspend the U.S. by about 40 % in 2030. | 2021–2030 | Statement of ratios; underlying series not published. |
| Science & Technology Action Committee memo (Dec 2024) | Scenario based on the memo’s premise: “If both countries’ current rate of R&D spending growth continues,” it produces a crossover in 2027. Methodology is descriptive of the condition. (Note: Specific growth rates used for projection are not provided in the text). | 2024–2030 | Not provided |
| Hu Angang (Springer chapter) (2023) | GDP-driven projection using stepped average annual growth rates for China: 5.5% (2021-25), decreasing to 4.5% (2030-35). This implies China’s per capita GDP reaching over 40% of the US level by 2035. | 2025–2035 | Constant‑2017 PPP; converted to 2020 PPP. |
| ITIF policy brief (Apr 2025) | Uses 2023 GERD estimates plus a cost-efficiency adjustment multiplying China’s spending by 2.3x; cites historical average growth (2019-23) of ≈ 8.9% for China and 4.7% for the U.S. | 2023–2030 | Raw and “efficiency‑adjusted” views; rebased to 2020 PPP. |